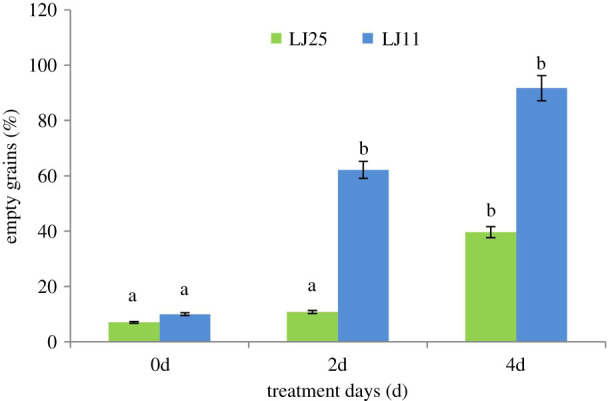
Figure 1.

Effect of chilling stress on the percentage of empty grains in LJ25 and LJ11 under different chilling stress periods. The letters represent significant differences of comparison among control group (0d) and treatment groups (2d and 4d) for each genotype. The letter ‘a’ represents no significant difference of comparison between two genotypes at each treatment, the letter ‘b’ represents significant differences of comparison between two genotypes at each treatment with p < 0.05.
