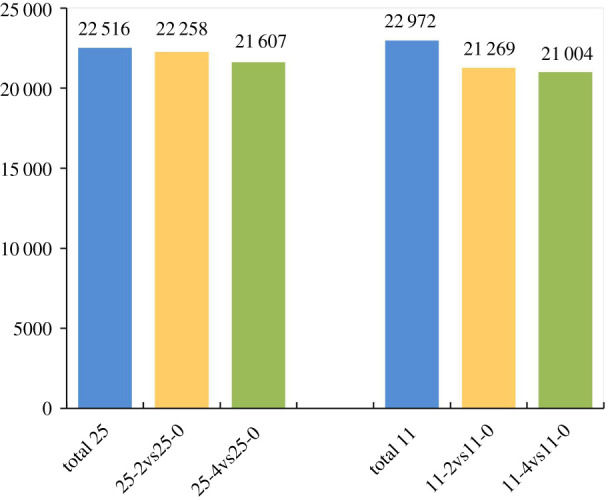
Figure 2.

Histogram of expressed genes of LJ11 and LJ25 under different chilling stress periods. The numbers above the columns represent the number of expressed genes identified after 0, 2 and 4 days of chilling stress on LJ25 and LJ11, respectively.
