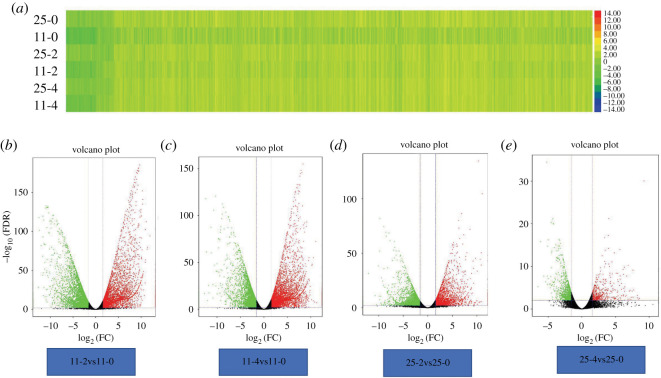
Figure 3.
Statistical analysis of DEGs in LJ25 and LJ11 during chilling stress. (a) Heatmap displaying the expression levels of all identified DEGs in both LJ25 and LJ11 after 0, 2 and 4 days of chilling stress. (b–e) Volcano Plots of FDR versus fold change displaying the DEGs identified in compared groups: 11-2vs11-0, 11-4vs11-0, 25-2vs25-0 and 25-4vs25-0, respectively, as indicated. The green dots represent downregulated genes, the red dots represent upregulated genes and the black dots represent genes that are not differentially expressed.

