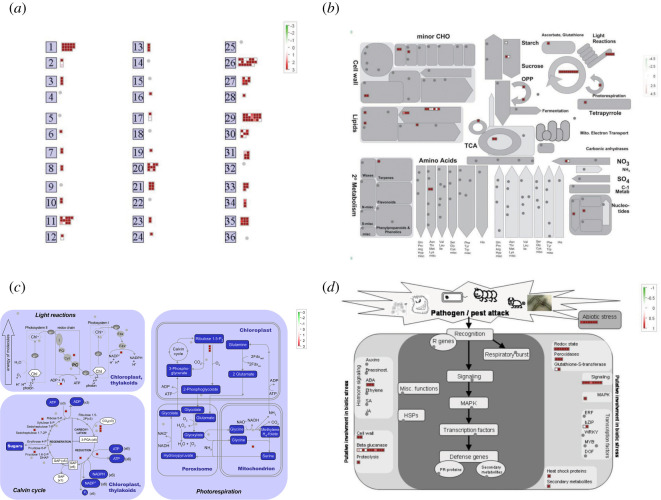
Figure 6.
MapMan analysis of the DEGs involved in the GO term ‘response to cold’ in LJ25 and LJ11 after the entire chilling stress period. The total overview (a) and the overviews of metabolism (b), photosynthesis (c), and biotic stress (d) were mapped with the DEGs involved in the GO term ‘response to cold’. Red boxes represent groups of genes upregulated by chilling stress, white boxes represent groups of genes whose expression was unaffected by chilling stress. Details are presented in electronic supplementary material, table S6.

