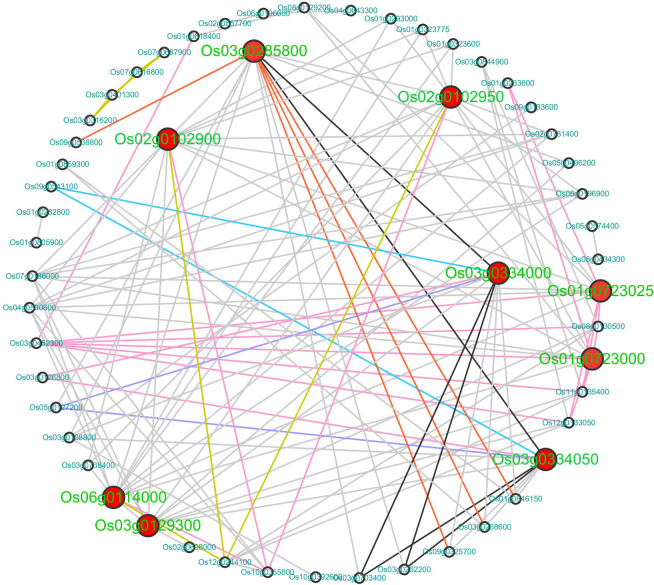
Figure 7.
Interacting networks of DEGs regarding the GO term ‘response to cold’ in LJ25 and LJ11 following different chilling stress periods predicted by STRING and visualized in Cytoscape. The larger, red circles represent the hub genes with the gene IDs shown in green. The small, black circles represent other genes involved in interacting networks with the gene IDs shown in blue. Dark blue lines represent activation, light blue lines represent expression, and grey lines represent binding. Yellow lines represent catalysis, black lines represent inhibition, orange lines represent post-translational modification (ptmod), and pink lines represent reaction.

