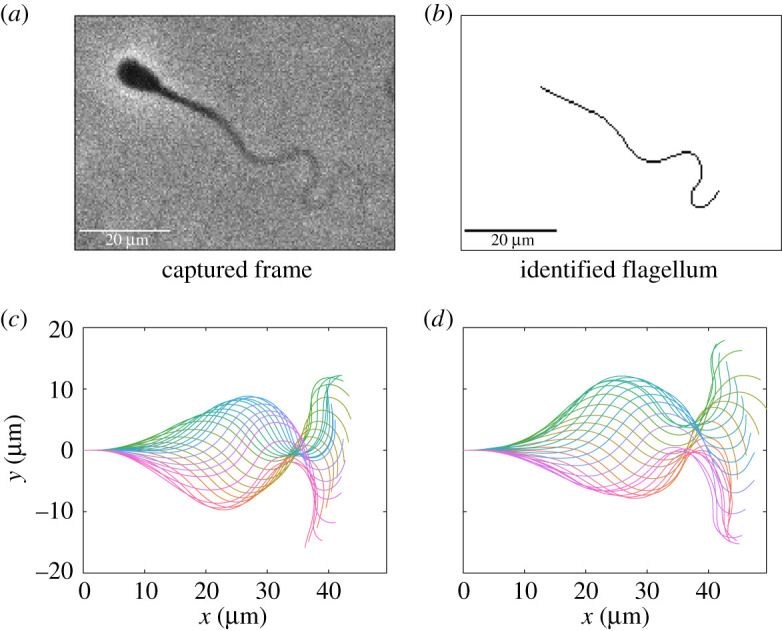
Figure 1.

A sample captured frame from a fresh spermatozoon, the identified flagellum and complete waveform, accompanied by a synthetic waveform constructed from the presented dataset using the method of generation proposed in §2.4 with Ns = 10. (a,b) Raw image data alongside the flagellum as identified using the automated methodology of [23], with the vast majority of the flagellum being captured. (c) A captured waveform over a single beating period, with a sample synthetic beat shown in panel (d) generated following equation (2.2), drawing flagellar arclength and beating period from their respective empirical distributions. In panels (c,d), plotted in different colours are the shapes of the flagella at select timepoints within one period, with the base of each flagellum situated at the origin of their respective Cartesian coordinate systems. We remark that these waveforms are qualitatively similar, with the proposed sampling method replicating the mean and variance of the empirical waveform distribution by construction. The waveforms in panels (c,d) have been rescaled by the original and sampled flagellum lengths in order to enable comparison to imaging data.
