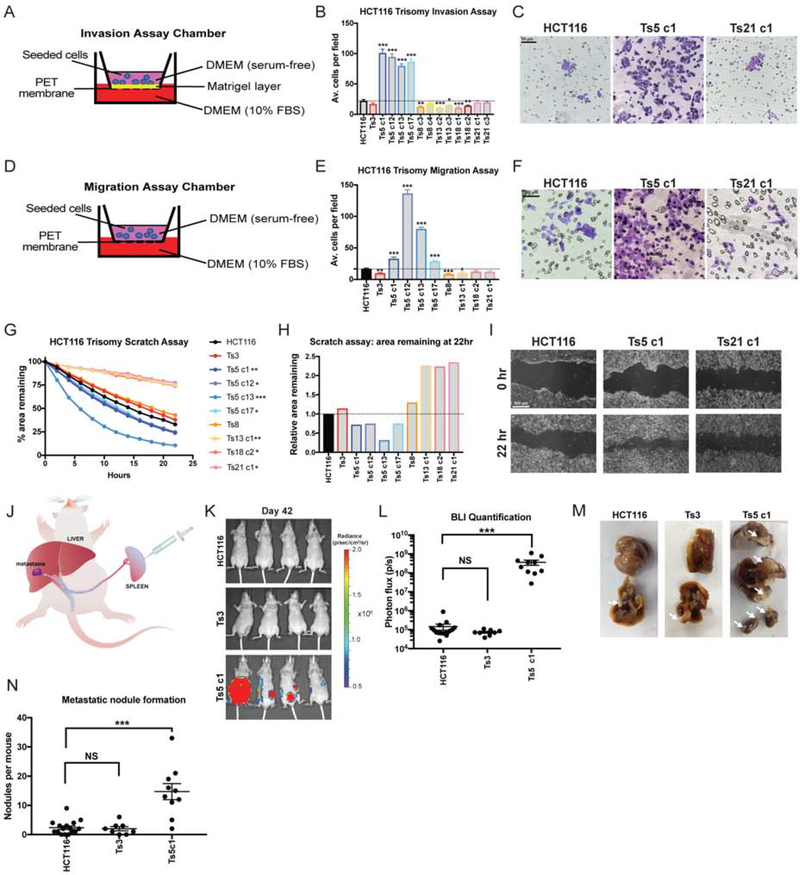
Figure 1. Gaining chromosome 5 increase invasion, migration, and motility in colon cancer cells.
(A) Schematic diagram of the invasion assay. Cells are seeded in the upper chamber in serum-free media while the bottom chamber contains media supplemented with 10% FBS.
(B) Quantification of the average number of cells per field that were able to cross the membrane in the invasion assay. Averages represent three independent trials in which 15–20 fields were counted.
(C) Representative images of HCT116, HCT116 Ts5 c1, and HCT116 Ts21 c1 invasion stained with crystal violet.
(D) Schematic diagram of migration assay. The setup is similar to the invasion assay except that the membrane does not have a matrigel layer.
(E) Quantification of the average number of cells per field that were able to cross the membrane in the migration assay. Averages represent three independent trials in which 15–20 fields were counted.
(F) Representative images of HCT116, HCT116 Ts5 c1, and HCT116 Ts21 c1 migration stained with crystal violet.
(G) Quantification of cell motility in a scratch assay. The percent area remaining between two monolayers separated by a pipette tip-induced scratch was monitored for 22 hours. Minimum of 2 trials per cell line.
(H) The ratio of the area remaining at 22 hours after the scratch is plotted relative to the HCT116 parental cell line. A ratio less than 1 indicates faster scratch closure relative to wild-type, while a ratio greater than 1 indicates slower scratch closure.
(I) Representative images of the scratch closure assay immediately after the scratch (0h) and at the end of the assay (22h) for HCT116, HCT116 Ts5 c1, and HCT116 Ts21 c1. Bars represent mean ± SEM. * p<0.05; ** p<0.005 *** p<0.0005. Scale bar, 50 and 200 μm
(J) A schematic of the colon cancer metastasis assay. Luciferase-expressing cells are injected into the mouse spleen, and then metastatic nodule formation in other organs is quantified.
(K) Luciferase imaging of mice injected with HCT116 or HCT116 Ts5 cells 42 days post-injection.
(L) Bioluminescence imaging quantification of the luciferase signal in mice injected with HCT116, HCT116 Ts3, and HCT116 Ts5 cells.
(M) Images of metastatic nodule formation from mice euthanized 42 days post-injection. White arrows indicate metastases.
(N) Quantification of the number of nodules per mouse (HCT116 n = 16, HCT116 Ts3 n = 8, HCT116 Ts5 c1 n = 10). Bars represent mean ± SEM. Unpaired t-test * p<0.05; ** p<0.005 *** p<0.0005. Scale bar, 50 and 200 μm.

