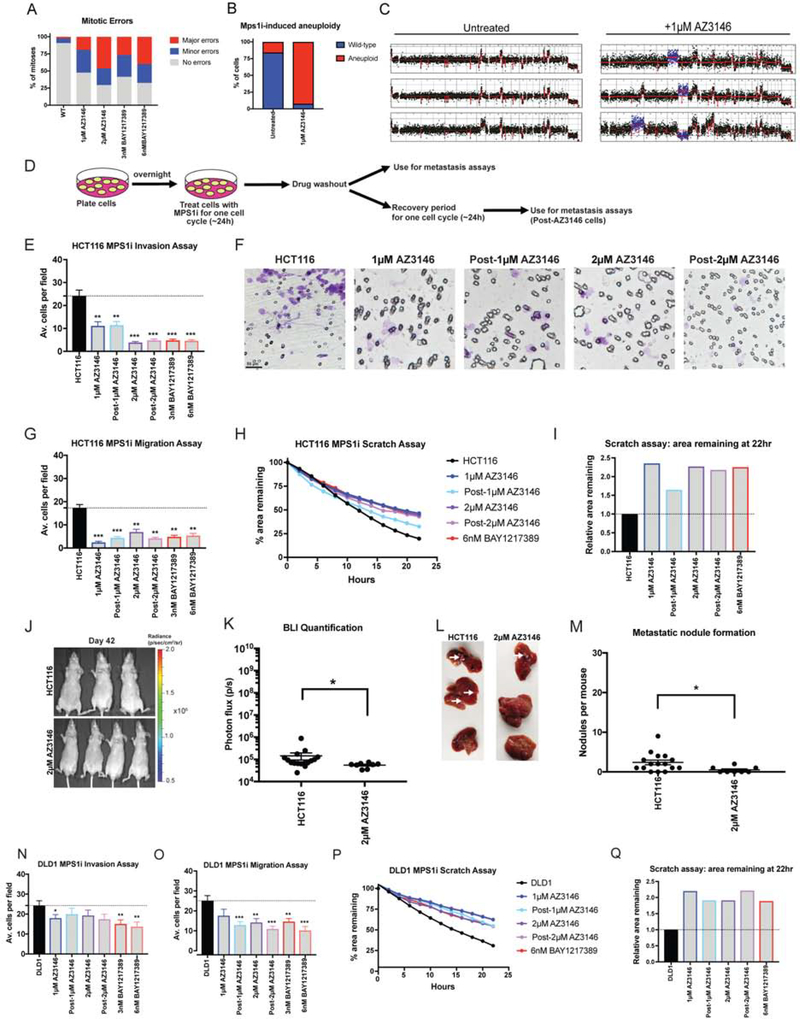
Figure 4. Chromosomal instability is insufficient to drive metastasis.
(A) Quantification of mitotic error frequency after Mps1 inhibitor treatment. A mitosis with “minor errors” exhibited a single lagging chromosome, anaphase bridge, or micronucleus, while a mitosis with “major errors” displayed more than one of these phenomena.
(B) The percent of cells with whole-chromosome aneuploidies in HCT116 cells +/− 1 μM AZ3146 are displayed.
(C) Representative karyotypes of single cells +/− 1 μM AZ3146.
(D) Schematic diagram of MPS1 inhibitor treatment and drug washout prior to metastasis assays.
(E, N) Quantification of the average number of cells per field that were able to cross the membrane in the invasion assay in either HCT116 or DLD1. Averages represent three independent trials in which 15–20 fields were counted.
(F) Representative images of invasion in the indicated Mps1i-treated cell lines.
(G, O) Quantification of the average number of cells per field that were able to cross the membrane in the migration assay in either HCT116 or DLD1.
(H, P) Quantification of the percent area remaining in the scratch assay after Mps1 inhibitor treatment.
(I, Q) The ratio of the area remaining at 22 hours after the scratch is plotted relative to the untreated parental cell line.
(J) Luciferase imaging of mice injected with HCT116 or AZ3146 treated cells 42 days post-injection.
(K) Bioluminescence imaging quantification of the luciferase signal in mice injected with HCT116 cells and HCT116 cells treated with 2 μM AZ3146.
(L) Images of metastatic nodule formation from mice euthanized 42 days post-injection. White arrows indicate metastases.
(M) Quantification of the number of nodules per mouse (HCT116 n = 16, AZ3146 n = 8). The animals injected with HCT116 cells are the same batch used in Figure 1N.
Bars represent mean ± SEM. Unpaired t-test * p<0.05; ** p<0.005 *** p<0.0005. Scale bar, 50 μm

