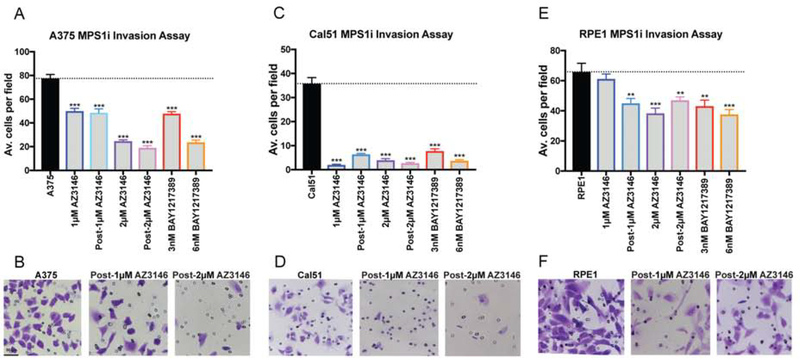
Figure 5. The effects of Mps1 inhibitor treatment on invasive behavior.
(A, C, E) Quantification of the average number of cells per field that were able to cross the membrane in the invasion assay in A375, Cal51 and RPE1. Averages represent two independent trials in which 15–20 fields were counted.
(B, D, F) Representative images of invasion in the indicated Mps1i-treated cell lines. Bars represent mean ± SEM. Unpaired t-test * p<0.05; ** p<0.005 *** p<0.0005. Scale bar, 50 μm.

