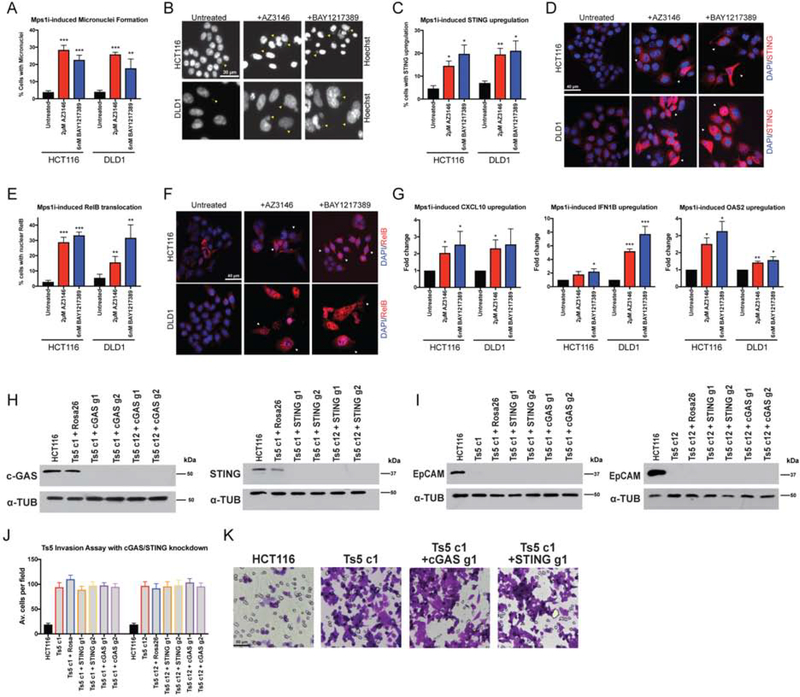
Figure 6. Mps1 inhibition activates cGAS/STING signaling.
(A) Quantification of the percent of cells with micronuclei after Mps1 inhibitor treatment in HCT116 and DLD1.
(B) Representative images of micronuclei after Mps1 inhibitor treatment. Yellow arrows indicate certain visible micronuclei.
(C) Quantification of the percent of cells with STING upregulation after Mps1 inhibitor treatment.
(D) Representative images of cells with STING upregulation after Mps1 inhibitors treatment. White arrows indicate certain cells with STING upregulation.
(E) Quantification of the percent of cells with nuclear RelB after Mps1 inhibitor treatment.
(F) Representative images of cells after Mps1 inhibitor treatment. White arrows indicate certain cells with nuclear RelB.
(G) qPCR quantification of several NFκB target genes.
(H) Western blot demonstrating the CRISPRi-induced knockdown of cGAS and STING in two HCT116 Ts5 clones.
(I) EpCAM expression after knockdown of cGAS and STING with CRISPRi in HCT116 Ts5 clones.
(J) Quantification of the average number of cells per field that were able to cross the membrane in the invasion assay after cGAS or STING knockdown.
(K) Representative images of the invasion assay in the indicated cell lines.
Bars represent mean ± SEM. Unpaired t-test * p<0.05; ** p<0.005 *** p<0.0005. Scale bar, 30, 40 and 50 μm

