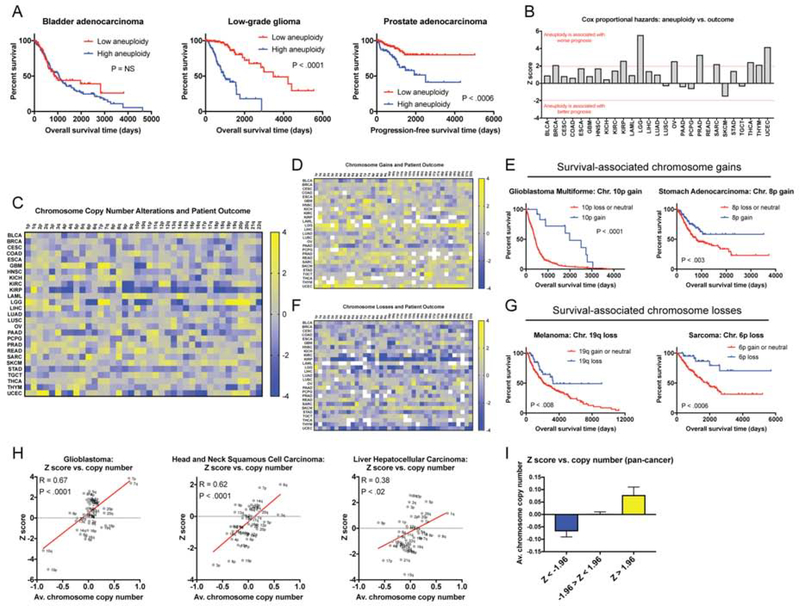
Figure 7. A pan-cancer analysis of chromosome copy number changes associated with patient survival.
(A) The total number of aneuploid chromosomes in each tumor was calculated according to (Taylor et al. 2018). In each cancer type, patients were subdivided into two groups: low aneuploidy (≤ 20th percentile aneuploidy score) and high aneuploidy (≥ 80th percentile aneuploidy score). Kaplan-Meier curves are shown for three cancer types.
(B) Z scores from Cox-proportional hazards analysis based on the aneuploidy scores, as described above, are displayed. Note that Z > 1.96 indicates a significant association between higher aneuploidy and death, while Z < −1.96 indicates a significant association between higher aneuploidy and survival.
(C) A heatmap comparing chromosome arm copy number vs. patient outcome across 10,133 patients with 27 different types of cancer. The color-bar indicates the Z score from the Cox analysis. For visualization purposes, Z scores were capped at 4 and −4.
(D) A heatmap comparing dichotomized chromosome arm copy number vs. patient outcome across 10,133 patients with 27 different types of cancer. In this analysis, survival was compared between patients in which a given arm was gained and patients in which a given arm was either lost or was copy-neutral. The color-bar indicates the Z score from the Cox analysis. For visualization purposes, Z scores were capped at 4 and −4.
(E) Representative Kaplan-Meier curves of two instances in which chromosome gains are associated with improved patient prognosis.
(F) A heatmap comparing dichotomized chromosome arm copy number vs. patient outcome across 10,133 patients with 27 different types of cancer. In this analysis, survival was compared between patients in which a given arm was lost and patients in which a given arm was either gained or was copy-neutral. The color-bar indicates the Z score from the Cox analysis. For visualization purposes, Z scores were capped at 4 and −4.
(G) Representative Kaplan-Meier curves of two instances in which chromosome losses are associated with improved patient prognosis.
(H) Scatter plots comparing the average chromosome copy number vs. the Z score obtained from Cox analysis for three different cancer types.
(I) A bar graph displaying the average chromosome copy number across all 27 cancer types, binned based on the Z score from the Cox model.

