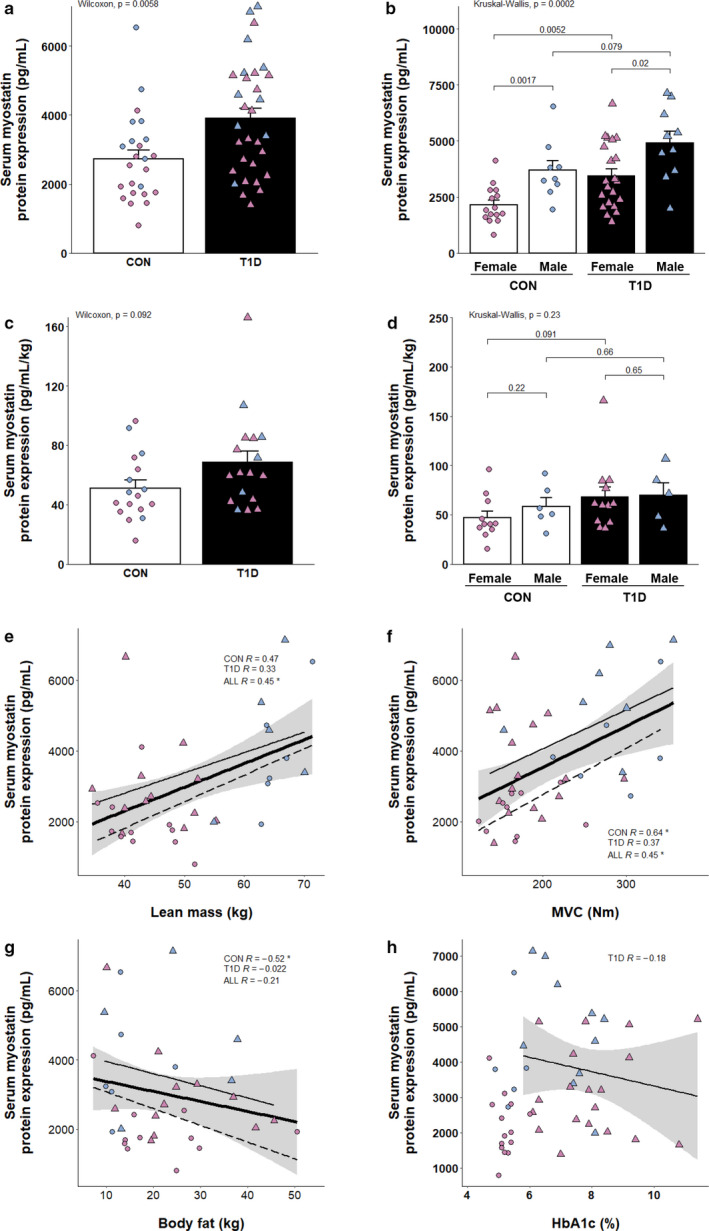
FIGURE 1.

Elevated expression of serum myostatin and its correlates in T1D. (a) Serum myostatin expression as measured by ELISA (CON, n = 24; T1D, n = 31). (b) Serum myostatin expression as measured by ELISA, men and women analyzed separately (CON, n = 24; T1D, n = 31). (c) Serum myostatin expression as measured by ELISA normalized to lean mass (CON, n = 17; T1D, n = 17). (d) Serum myostatin expression as measured by ELISA normalized to lean mass, men and women analyzed separately (CON, n = 17; T1D, n = 17). Scatter plots summarizing the relationship between myostatin and various metrics are shown in (e–h). (e) Serum myostatin versus lean mass in kilograms (CON, n = 17; T1D, n = 17). (f) Serum myostatin versus maximal voluntary contraction strength (MVC; CON, n = 16; T1D, n = 23). (g) Serum myostatin versus whole‐body fat in kilograms (CON, n = 17; T1D, n = 17). (h) Serum myostatin versus HbA1c (T1D, n = 29). For individual data points, circles indicate control participants, triangles indicate T1D, blue fill indicates men, purple fill indicates women. For regression lines, dashed lines indicate control participants, solid thin lines indicate T1D, solid thick lines indicate overall regression line, gray shading indicates standard error. Spearman's rho (displayed as R) and p‐values are displayed within graphical summary. *p < .05
