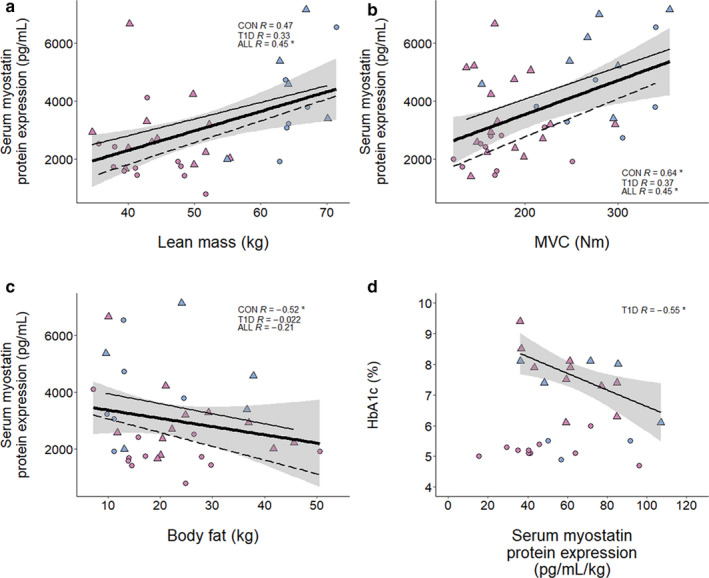
FIGURE 2.

Correlates of muscle myostatin protein expression with and without T1D. (a) Skeletal muscle myostatin expression as measured by Western blot (CON, n = 20; T1D, n = 20), with inlaid representative blot displaying 15 kDa band representing monomeric myostatin, and Coomassie Blue loading control. (b) Skeletal muscle myostatin expression, men and women analyzed separately (CON, n = 20; T1D, n = 20). Scatter plots summarizing the relationship between myostatin and various metrics are shown in (c–f). (c) Skeletal muscle myostatin versus lean mass in kilograms (CON, n = 14; T1D, n = 12). (d) Skeletal muscle myostatin versus MVC (CON, n = 10; T1D, n = 10). (e) Skeletal muscle myostatin versus body fat in kilograms (CON, n = 14; T1D, n = 12). (f) Skeletal muscle myostatin versus HbA1c in percent (T1D, n = 19). Analysis of publicly available microarray datasets are shown in (h, i). (h) Bar plot of muscle myostatin mRNA log2 fold change values relative to healthy control group from each respective study. White bars indicate insulin‐resistant (IR) groups, while black bars indicate T2D groups. p‐values are displayed outside of each bar. (i) Scatter plot depicting the correlation between muscle myostatin log2 mRNA expression and HbA1c in percent. Data obtained from GSE18732. For individual data points, circles indicate control participants, triangles indicate T1D, blue fill indicates men, purple fill indicates women. For regression lines, dashed lines indicate control participants, solid thin lines indicate T1D, solid thick lines indicate overall regression line, gray shading indicates standard error. Spearman's rho (displayed as R) and p‐values are displayed within graphical summary. *p < .05
