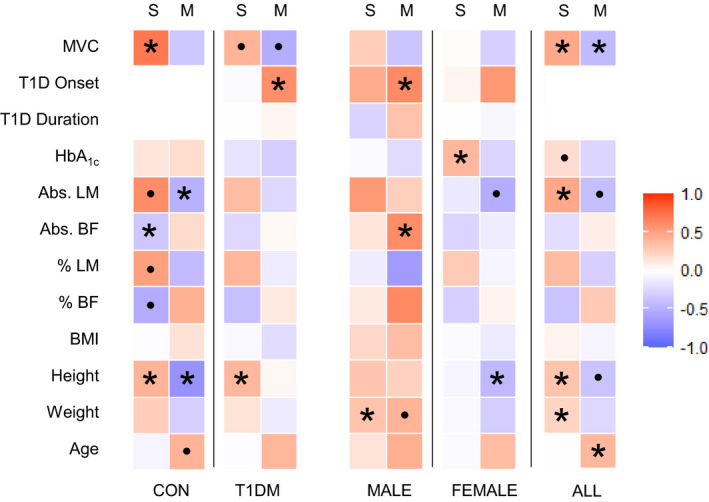
FIGURE 3.

Summary of correlative analyses in groupings of the present study. Heat map summarizing strength of correlation between clinical metrics in this study and myostatin protein expression in the serum (S, top) and muscle (M, top). Variables are displayed along the left side including: maximal voluntary contraction (MVC), age of T1D diagnosis (T1D Onset), duration of T1D (T1D Duration), HbA1c, absolute lean body mass (Abs. LM), absolute body fat (Abs. BF), relative lean body mass (% LM), relative body fat (% BF), body mass index (BMI), height, weight, and age. Participants have been grouped as healthy controls (CON), diabetic participants (T1D), males (MALE), females (FEMALE), and overall cohort (ALL). For each square, red fill represents positively correlated variables, blue fill represents negative correlation. Intensity of fill represents the strength of correlation. *p < 0.05; ●p < 0.1
