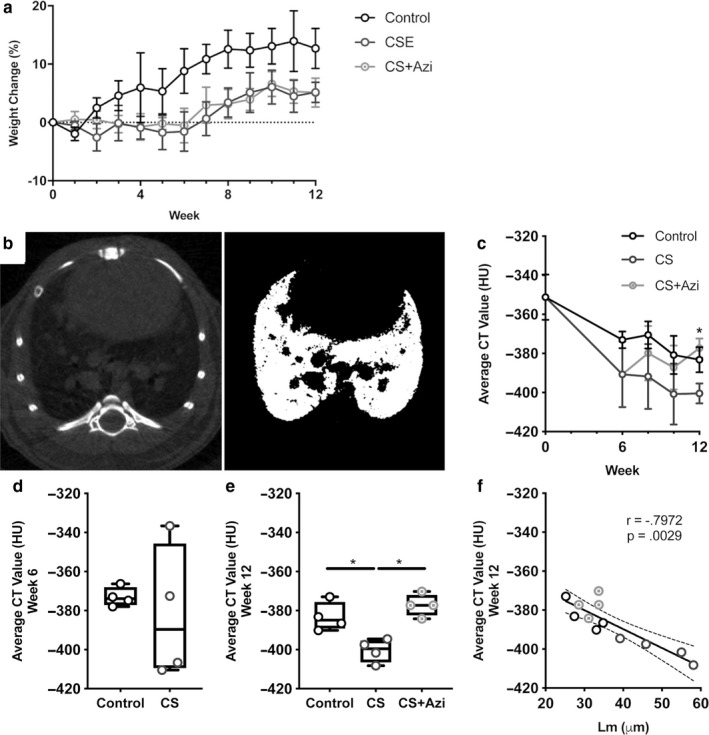
FIGURE 1.

Emphysematous changes in CS‐exposed mice via micro‐CT analysis of the lower lung are attenuated by azithromycin. (a) Percentage changes in mouse weight over time. (b) Representative micro‐CT image slice of a mouse lung prior to processing (left) and postthresholding (right). (c) Time course of average Hounsfield unit (HU) values of the lower lungs (mean ± SD). (d) Average HU values at week 6. (e) Average HU values at week 12 prior to postmortem. (f) Correlation of week 12 average HU values with Lm. Data presented as median ± range (unless otherwise stated). * represents significance between cohorts, p < .05. Dotted lines show the 95% confidence interval
