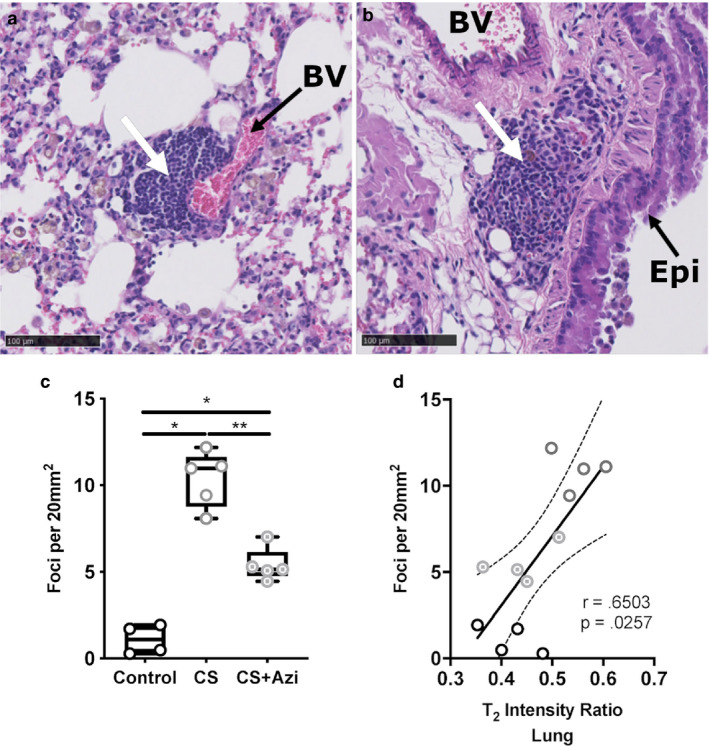
FIGURE 4.

CS‐exposed mice showed increased leukocyte infiltration into lung tissue that was attenuated by azithromycin. (a and b) H&E‐stained lung sections from CS‐exposed mice showing examples of leukocyte foci (white arrows) (a) near blood vessels (BV) and (b) airway epithelia (Epi). (c) Fold change in the number of leukocyte foci in the lungs. (d) Correlation between T2‐weight MRI intensity values and leukocyte foci in the lung. Data presented as median ± range. Dotted lines show the 95% confidence interval. * represents significance between cohorts, p < .05; ** indicates p < .01. Dotted lines show the 95% confidence interval. n = 4–5 mice/group
