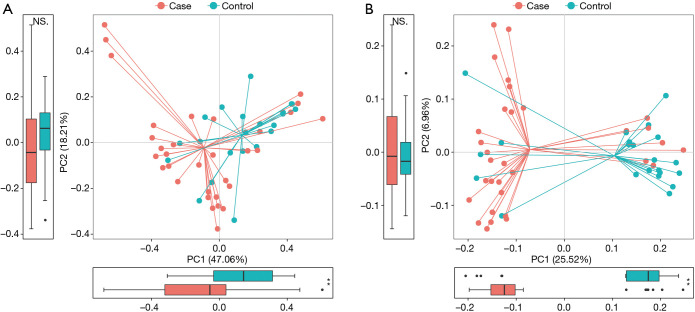
Figure S1.
Principal coordinate analysis (PCoA) based on weighted (A) and unweighted UniFrac distance matrix (B). The axes are labeled with the variation they explain. The proportion of variance explained by each principal component by groups was performed in the corresponding box plot. Red and blue dot represent cancer and nonmalignant control, respectively.

