Figure 1.
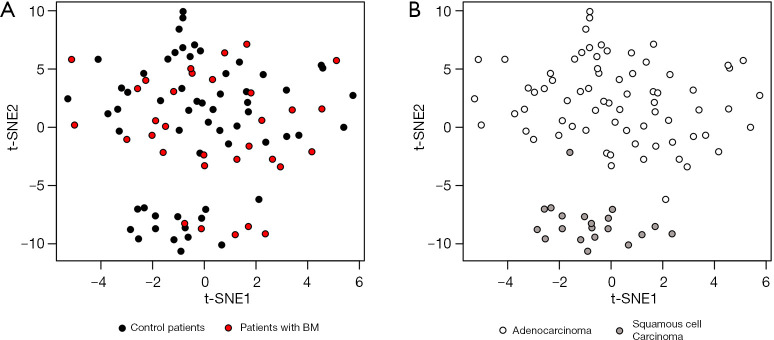
Visualization of global transcriptional profile across patients. t-SNE plots of all patients included in this study color-coded by (A) brain metastasis development, where black/red denotes Control/BM patients respectively; (B) histology classification, where white/light-grey denotes adenocarcinoma/squamous cell carcinoma respectively.

