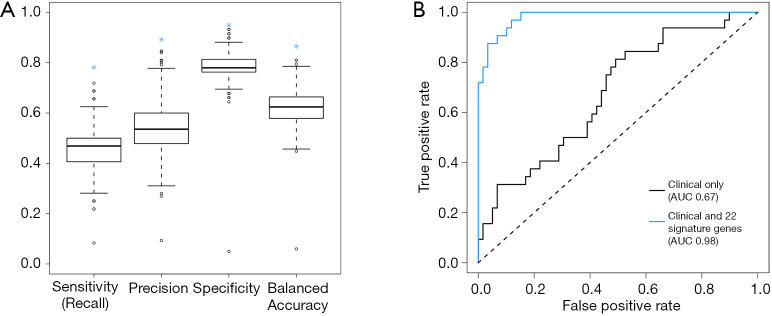
Figure 2.
Performance evaluations of clinical and transcriptional based models. (A) Simulation of 1,000 logistic regression models, each includes a random selection of 101 genes combined with clinical parameters, was performed to assess the performance of the clinical and transcriptional based model. Boxplots for different quality measures are shown for these random models, whereas our model is marked with a blue asterisk. (B) False- (x-axis) and true-positive (y-axis) rates of the clinical parameters based (black) and clinical combined with 22-signature genes (blue) logistic regression model predictions. These rates are calculated based on the comparison between predicted BM and known BM.

