Figure 4.
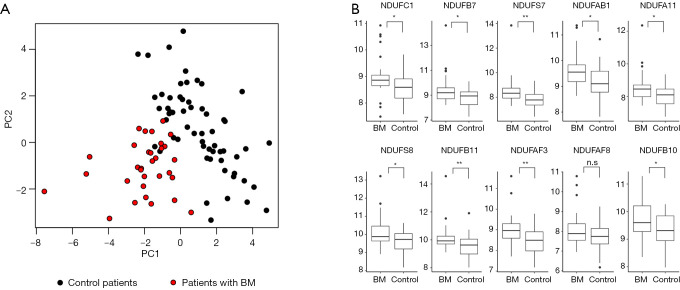
Oxidative phosphorylation pathway genes are upregulated in BM patient specimens. (A) PCA plot of all patients included in this study color-coded by brain metastasis development (black/red Control/BM respectively). (B) Boxplots of genes from the Oxidative Phosphorylation pathway that were differentially expressed between BM and Control patients. *, P<0.05; **, P<0.005. n.s., non-significant.

