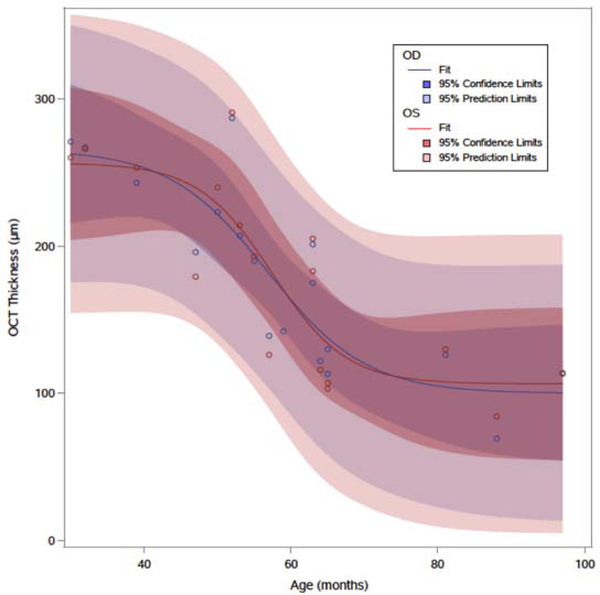
Figure 1:
Estimated non-linear regression model correlating right (OD, blue) and left (OS, red) eye OCT central subfield thickness with advancing age. The estimated curve demonstrates a period of accelerated thinning of the central subfield thickness and symmetry in the overall profile and confidence intervals between the two eyes. Age (months), OCT thickness (central subfield thickness, μm).

