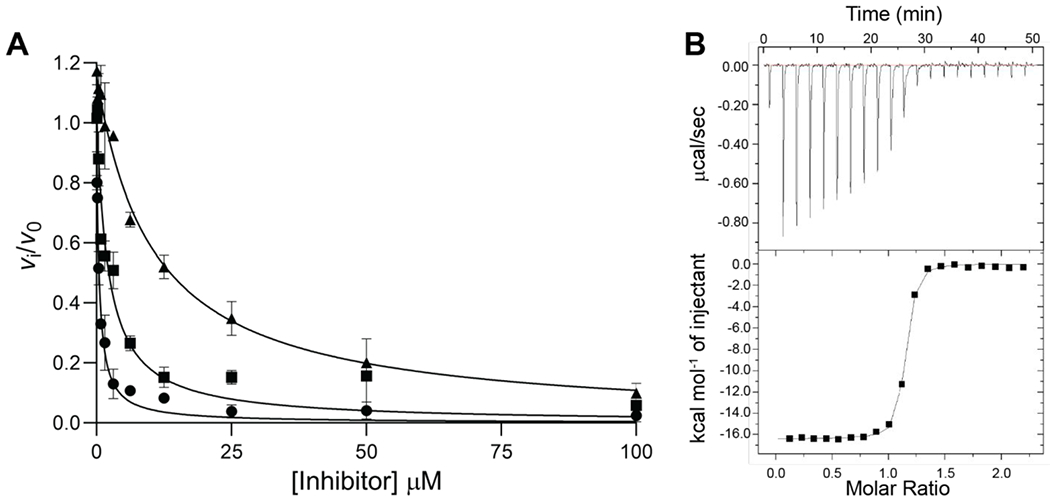
Figure 5.

A) Concentration-response plot for NpsA inhibition by 5, 8 and 9: 3-hydroxyanthraniloyl-AMS 5 (circle), 3-hydroxybenzoyl-AMS 8 (square), anthraniloyl-AMS 9 (triangle). The curve represents the best non-linear fit to the Morrison equation. Data are average (±SD) of triplicate experiments. B) Representative ITC binding isotherm of binding 5 to NpsA. (Top) Data obtained by titration of 25 nM NpsA with 0.25 μM 5. (Bottom) The integrated curve showing experimental points and the best fit (−).
