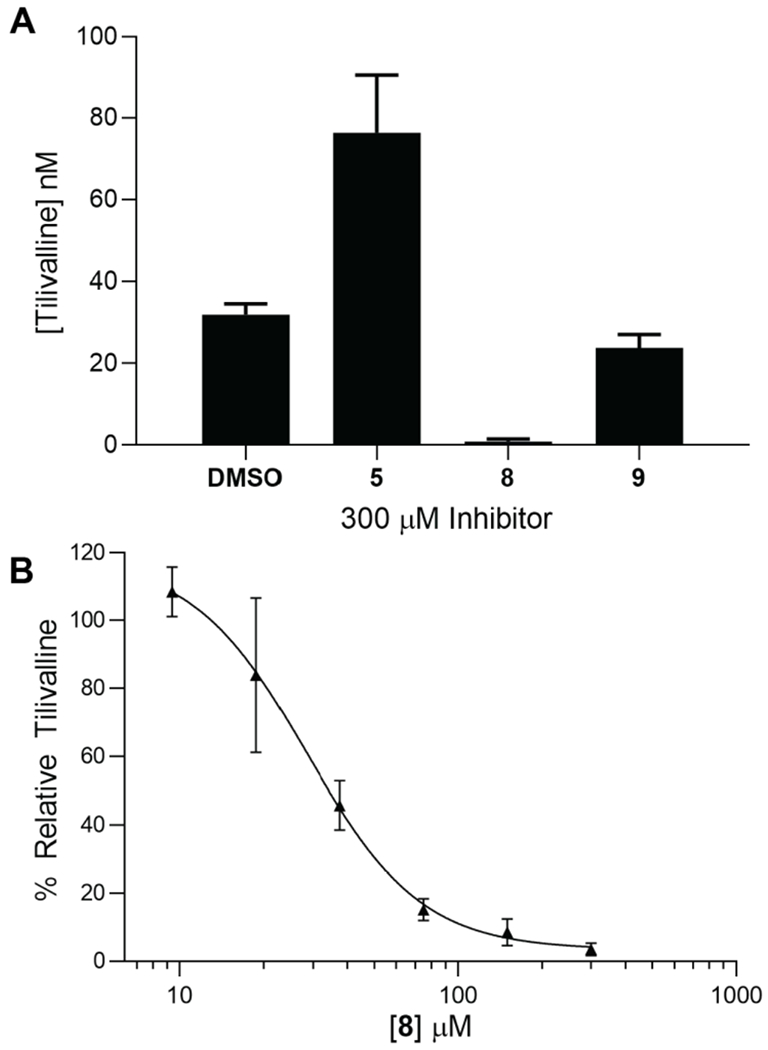
Figure 8.

A) Cultures inoculated with K. oxytoca to a starting OD600 = 0.01 with 300 μM of 5, 8, 9 or 0.6% DMSO as a negative control were grown for 8 hours at 37 °C in CASO medium shaking at 250 rpm. Tilivalline production was quantified using LC-MS/MS and the m/z transitions 334.4→199.1 [tilivalline (analyte)] and 424→199.1 [O-benzyltilivalline (internal standard)]. B) Concentration-response plot of the normalized % production of tilivalline at 8 hours under the incubation conditions described in panel A relative to a DMSO-only control versus the concentration 3-hydroxybenzoyl-AMS 8. The curve was fit to a four-parameter Hill equation to provide an IC50 value of 29 ± 4 μM and a Hillslope of −2.1 ± 0.5. The data points represent the mean (±SD) of two independent experiments.
