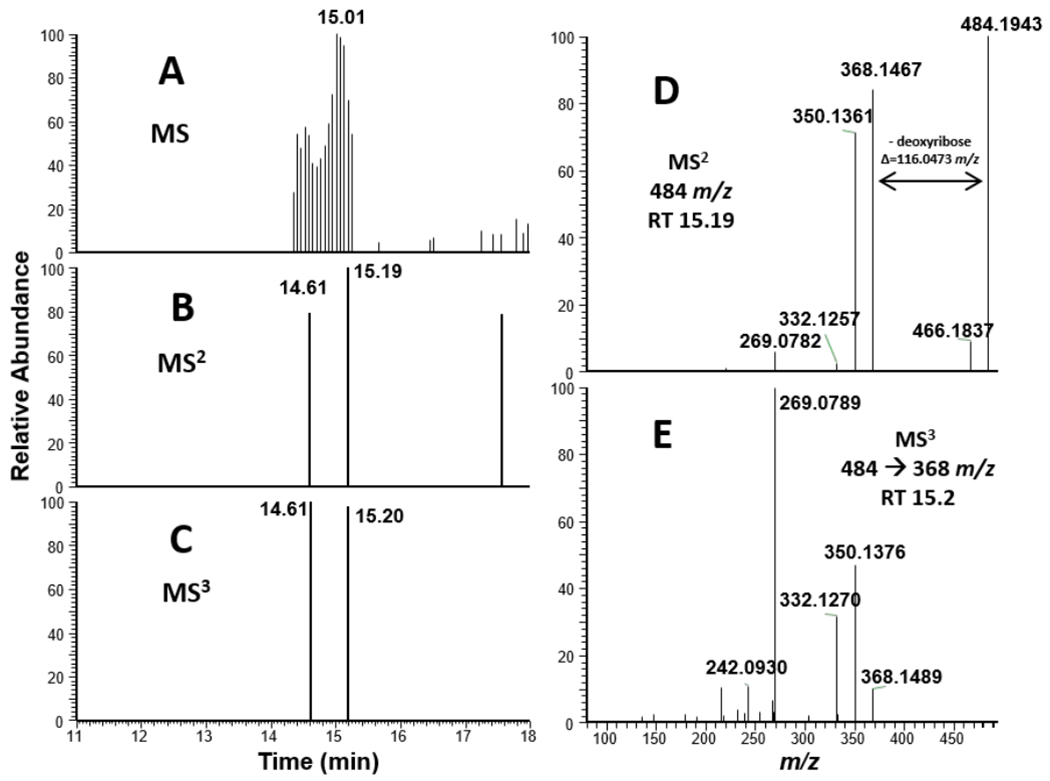
Figure 9.

Mass spectral data for ctDNA treated with tilimycin. A.) MS1 EIC of 484.1939 m/z. B.) MS2 data dependent event for 484.1939 m/z. C.) MS3 triggered event for 484.1939→368.1466 m/z (neutral loss of deoxyribose). D.) MS2 mass spectrum from fragmentation of 484 m/z at retention time = 15.19 min. E.) MS3 mass spectrum from fragmentation of 484.1939→368.1466 m/z at retention time = 15.20 min.
