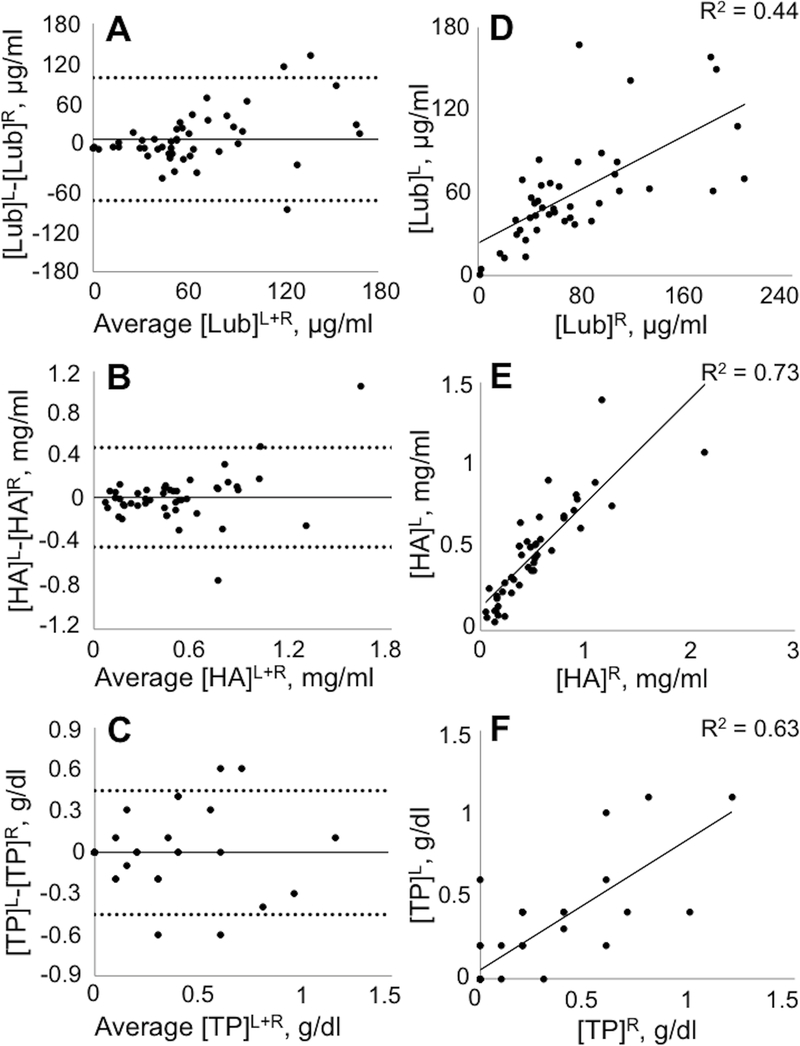
Figure 1.
Graphical representation of similarity of synovial fluid parameters between left versus right healthy, high-motion equine joints. Bland-Altman plots of individual differences between left and right joints for lubricin (Lub) (A), hyaluronan (HA) (B), and total protein (TP) (C) concentrations plotted against their mean. The solid line represents the mean difference, and the dashed lines represent ±2 standard deviations of the individual difference. Data for left (y axis) and right (x axis) joints plotted for lubricin (D), hyaluronan (E), and total protein (F) concentrations. n = 54–59 joints.

