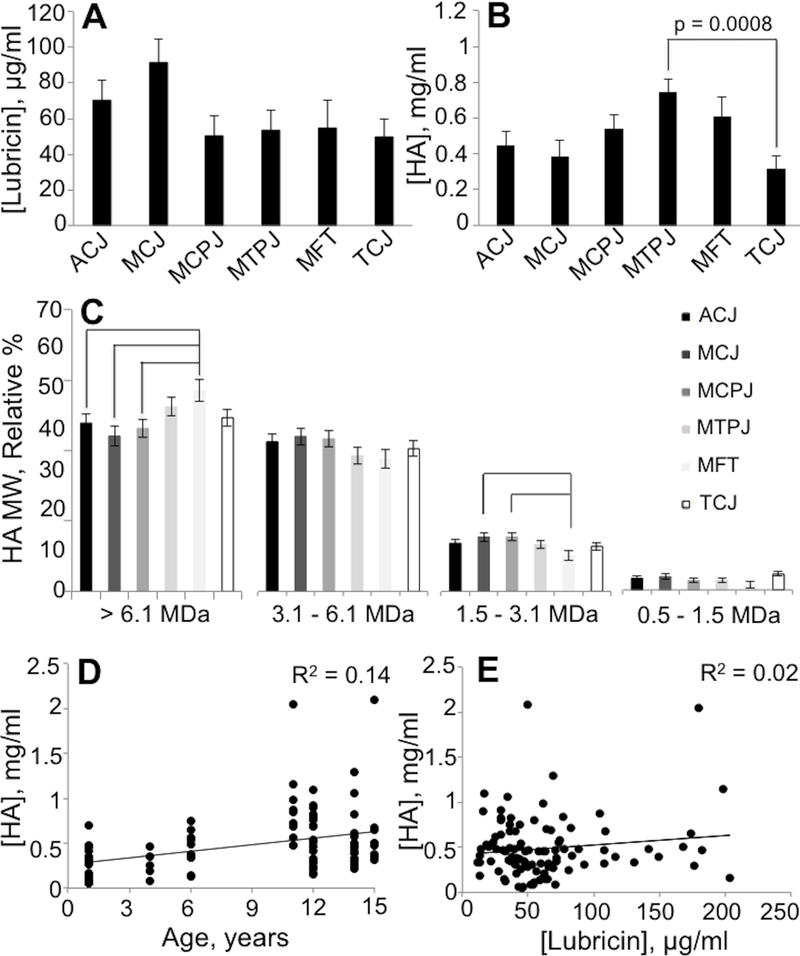
Figure 2.
Graphical representation of similarity of lubricin concentration (A), hyaluronan concentration (B), and relative proportions of hyaluronan molecular weight (C) in synovial fluid from various healthy, high-motion equine joints. Least square means ± standard error of the mean are plotted. Lines indicate a significant difference between joints. Scatterplots of hyaluronan versus age (D) and lubricin (E).

