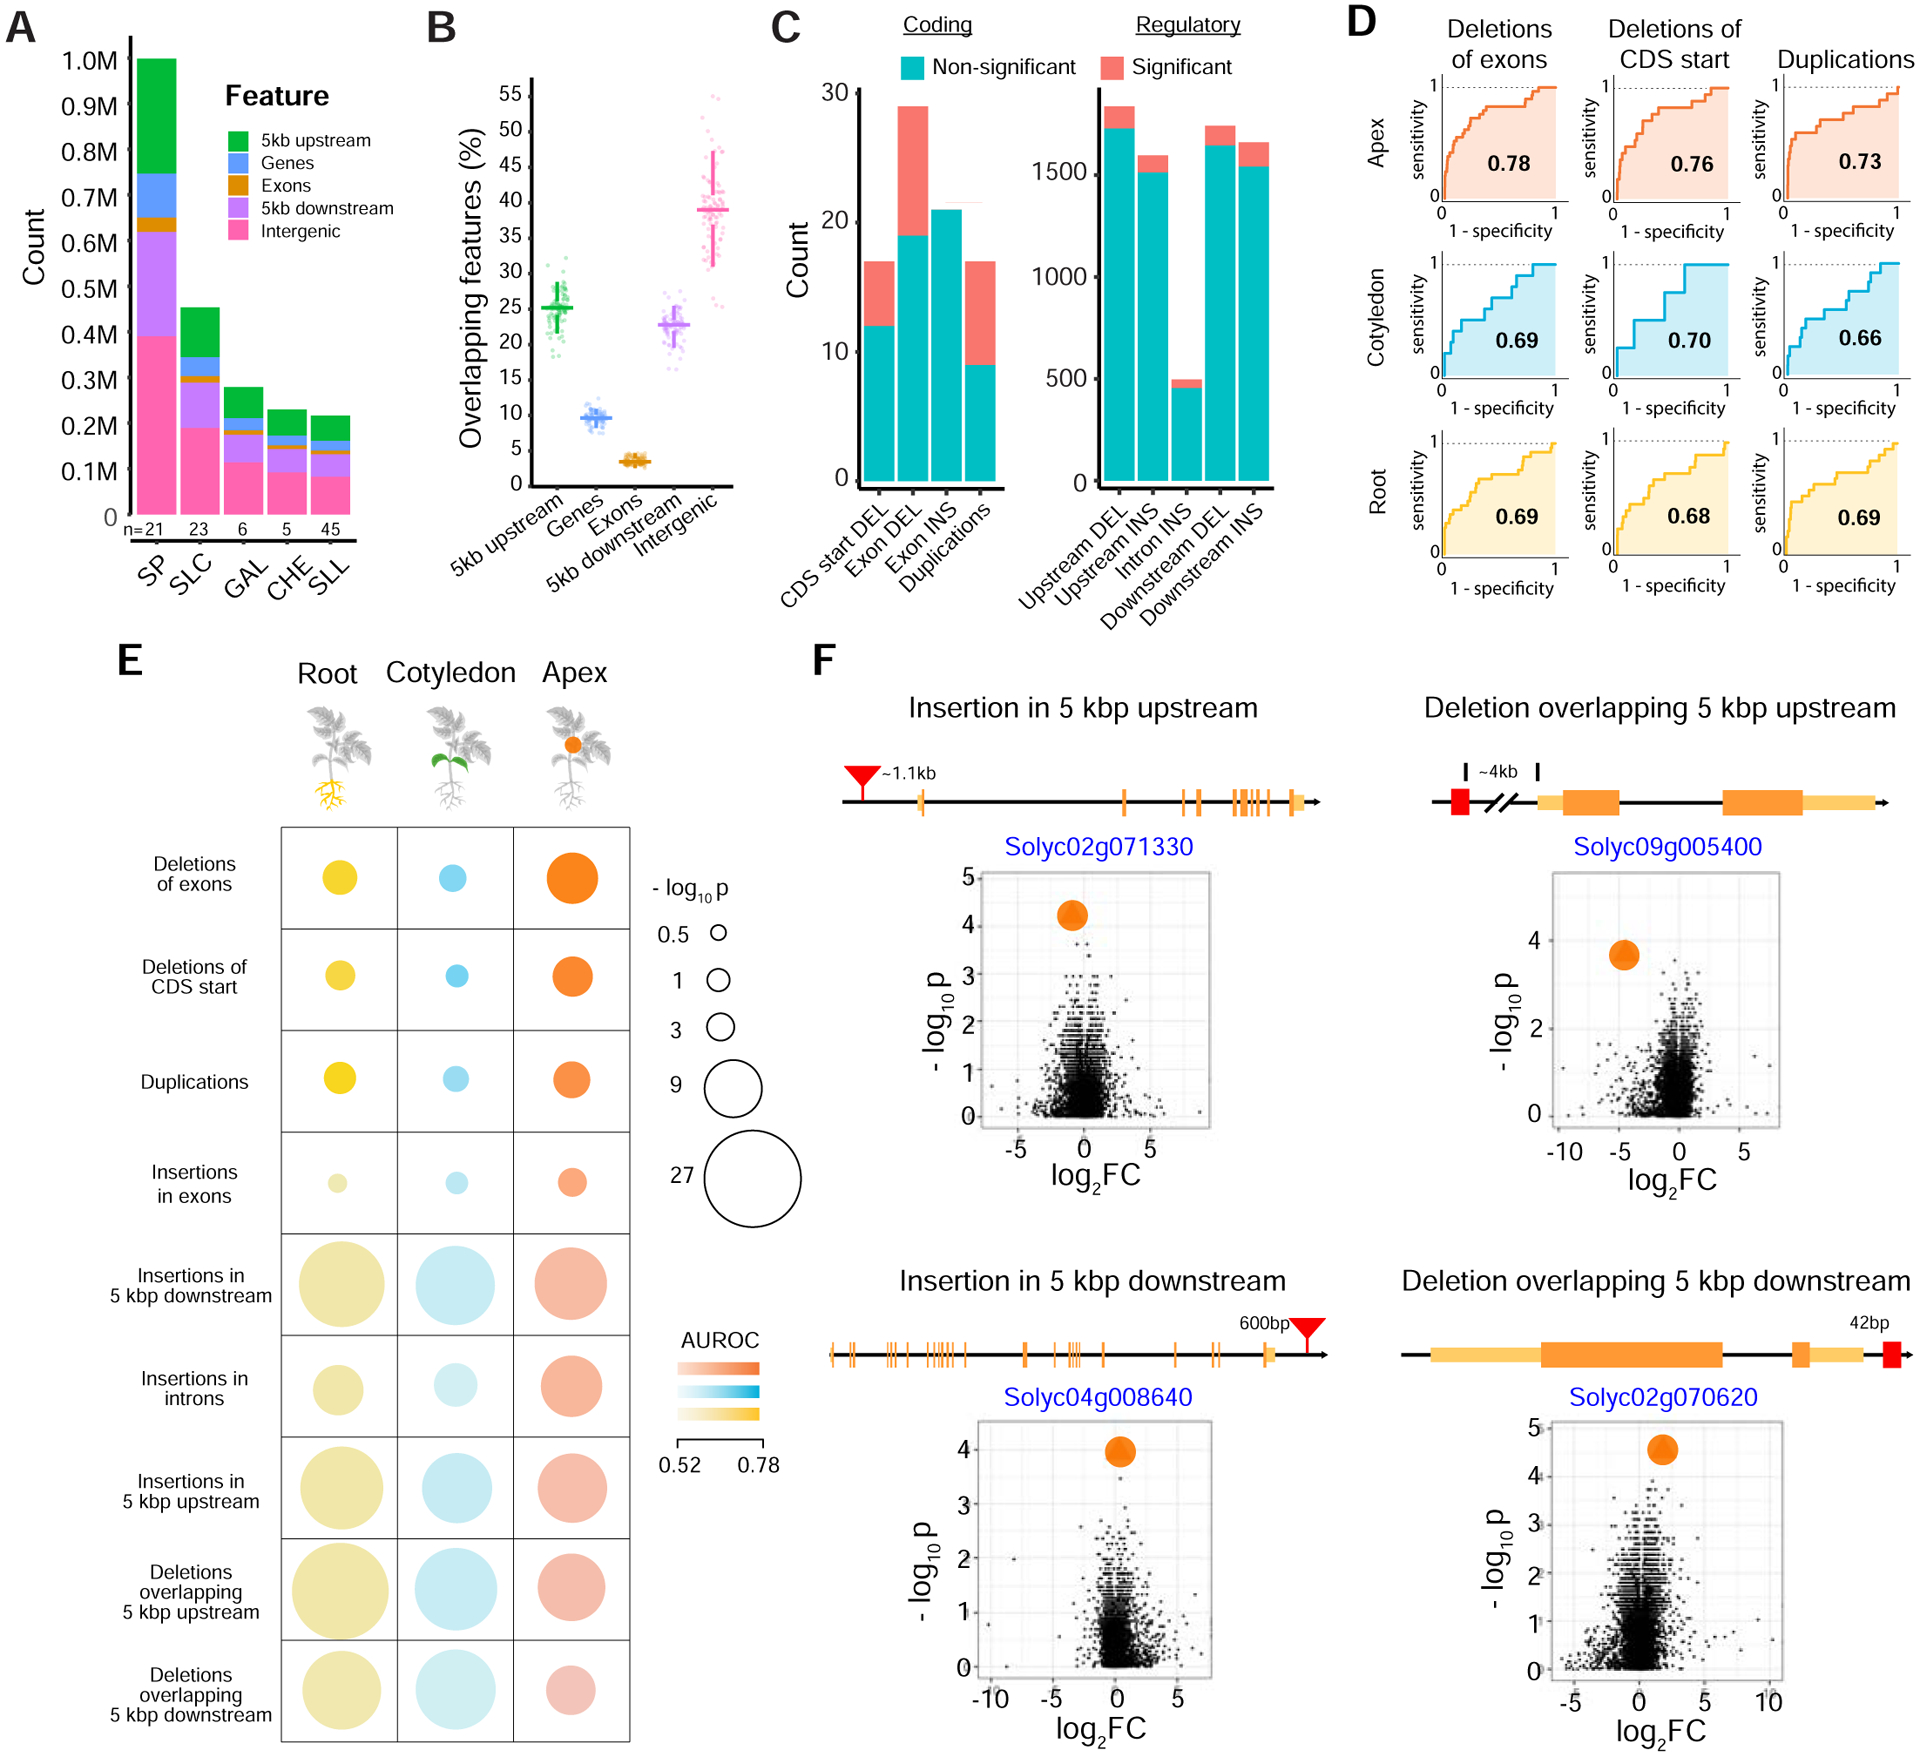
Figure 3. Gene associated SVs impact expression.

(A) Stacked bar chart showing total counts of SVs overlapping different genomic features in major taxonomic groups. N represents the number of accessions in each taxonomic group.
(B) Percentage of SVs overlapping different genomic features in 100 accessions. Each point is one sample. Fewer SVs are found within genes compared to surrounding regulatory regions.
(C) Stacked bar charts showing numbers of differentially expressed genes affected by insertion, deletion, and duplication SVs overlapping coding sequences (left) and regulatory regions (right)*. Differential expression was tested on common SVs in the 23 accessions used for RNA-sequencing (frequency between 0.2 and 0.8) (see STAR Methods).
(D) ROC curves for the top three SV annotation types, with high AUROC (Area Under the Receiver Operating Characteristics) scores across the three tissues demonstrating the ability to identify genes containing SVs using changes in expression across the accession split. The AUROC is specified within the ROC curve in each case. The steep rise of the curves in the top panel correspond to a near-perfect identification of a large fraction of the genes containing SVs based on differential expression. CDS, coding sequence.
(E) Differential expression significantly predicts genes with SVs. Overall performance of using “SV splits” and differential expression to predict associated gene(s) (see STAR Methods). Analyses are broken down into 9 categories across three tissues. Each category is defined based on SV type and relative position to genes. Circle sizes and colors represent the significance of performance (−log10 p-value) the magnitude of AUROC, respectively. SV categories are ranked in decreasing order of average AUC (Area Under the Curve) across the three tissues. Note that the significance of performance for each SV type is enhanced by the number of annotated SV-gene pairs (for example, p < 1×10⁻⁴ for ≈ 16 duplications, while p < 1×10⁻⁴ for ≈ 468 insertions in introns).
(F) Volcano plots for four regulatory SV-gene pair examples with the highest AUROC score highlight the extent of differential expression of SV-containing genes (marked in orange circles), compared to all expressed genes (black dots). Additional examples are presented in Figure S4F. p-values and expression fold changes are computed across two groups of accessions (with and without the indicated SV). Data shown for apex tissue. Exons (orange), UTRs (yellow), and SVs (red) are not drawn to scale. Distances between genes and SVs are shown.
* Significance is defined as an adjusted p-value less than 0.05. See also Figure S4.
