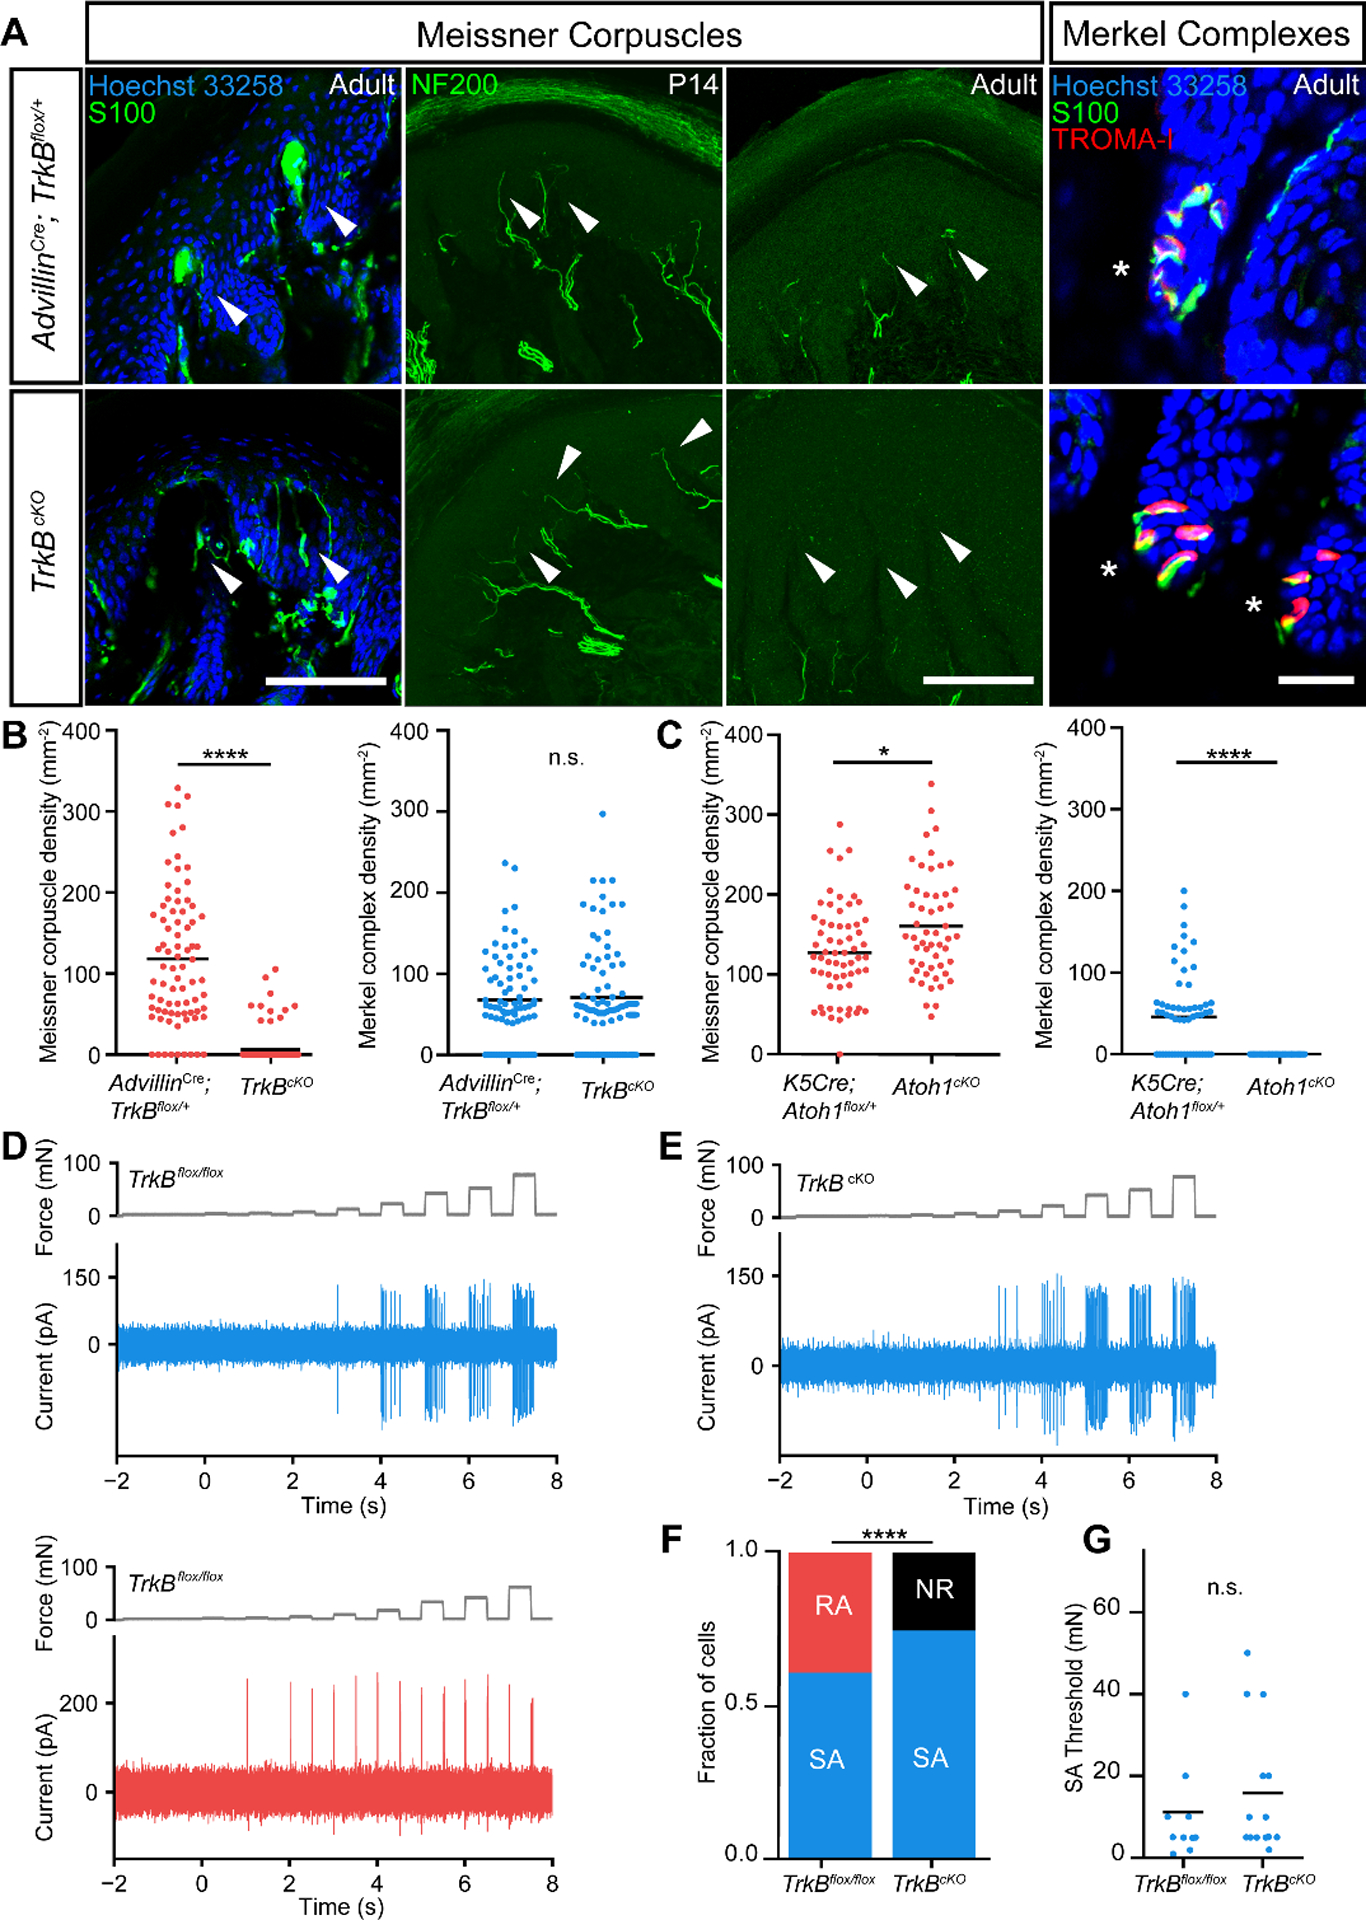
Fig. 1. Meissner corpuscles and their innervating Aβ-LTMRs are absent in TrkBcKO mice.

A. Digital pad sections from control (upper panels) and TrkBcKO mice (lower panels). Arrows and asterisks indicate typical locations of Meissner corpuscles and Merkel complexes, respectively. Meissner corpuscles and their afferents are labeled with S100 or NFH immunostaining in separate sections, respectively (scale bar = 100 μm). Merkel cells and associated nerve terminals are labeled with TROMA-I and S100, respectively (scale bar = 25 μm). B. Meissner corpuscle and Merkel complex density in glabrous pads of control and TrkBcKO mice. Dots represent individual sections, and black bars represent mean. (79 sections from 3 control mice and 81 sections from 3 TrkBcKO mice; two-tailed Mann-Whitney test, **** p < 0.0001 (U = 580), n.s. = not significant (U = 3163, p = 0.9016)). C. Meissner corpuscle and Merkel complex density in pads of K5Cre; Atoh1flox/+ and Atoh1cKO (K5Cre; Atoh1flox/flox) mice. Dots represent densities from individual sections and black bars represent means. (62 sections from 2 K5Cre; Atoh1flox/+ animals and 53 sections from 2 Atoh1cKO animals; two-tailed Mann-Whitney test, * p = 0.0113 (U = 1193), **** p < 0.0001 (U = 689)). D. In vivo recordings of a slowly adapting (SA, top, blue) and a rapidly adapting (RA, bottom, red) Aβ-LTMR from control mice in response to step indentations applied to glabrous hindpaw pedal pads (force records shown in gray). E. Example recording of an Aβ SA-LTMR from a TrkBcKO mouse in response to the same stimulus as in D. F. Proportion of neurons that are SA, RA, and not responsive (NR) to indentation in control (left, n = 18 cells) and TrkBcKO mice (right, n = 20 cells). χ2 test: χ2 = 8.5, p = 0.004. G. Mean (black bars) and individual (circles) thresholds of Aβ SA-LTMRs in control (left, n = 11 cells) and TrkBcKO mice (right, n = 15 cells). Unpaired t-test: t = −0.81, p = 0.42.
