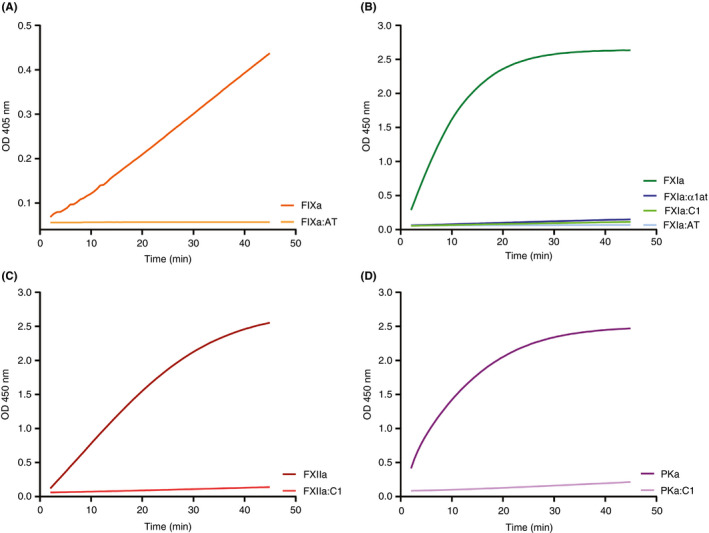
Figure 3.

Generation of assay standards. Equal nanomolar concentration of active enzyme or enzyme:serpin complexes generated in vitro, were mixed with chromogenic substrates specific for the respective enzyme. Change in absorption of 450‐nm light measured by optical density (OD) is indicated on the Y axis, and time in minutes is indicated on the X axis. (A) FIXa and FIXa:AT complexes. (B) FXIa and complexes of FXIa:α1at, FXIa:AT, and FXIa:C1. (C) FXIIa versus XIIa:C1 complexes. (D) PKa compared to PKa:C1 complexes. Data are representative of 2 independent experiments; each condition was measured in triplicate and the average is depicted. α1at, alpha‐1 antitrypsin; AT, antithrombin; C1, C1 esterase inhibitor; FIXa, activated factor IX; FXIa, activated factor XI; FXIIa, activated factor XII; PKa, active enzyme of kallikrein
