
Fig.1. Overview of the samples used and the computational analysis.
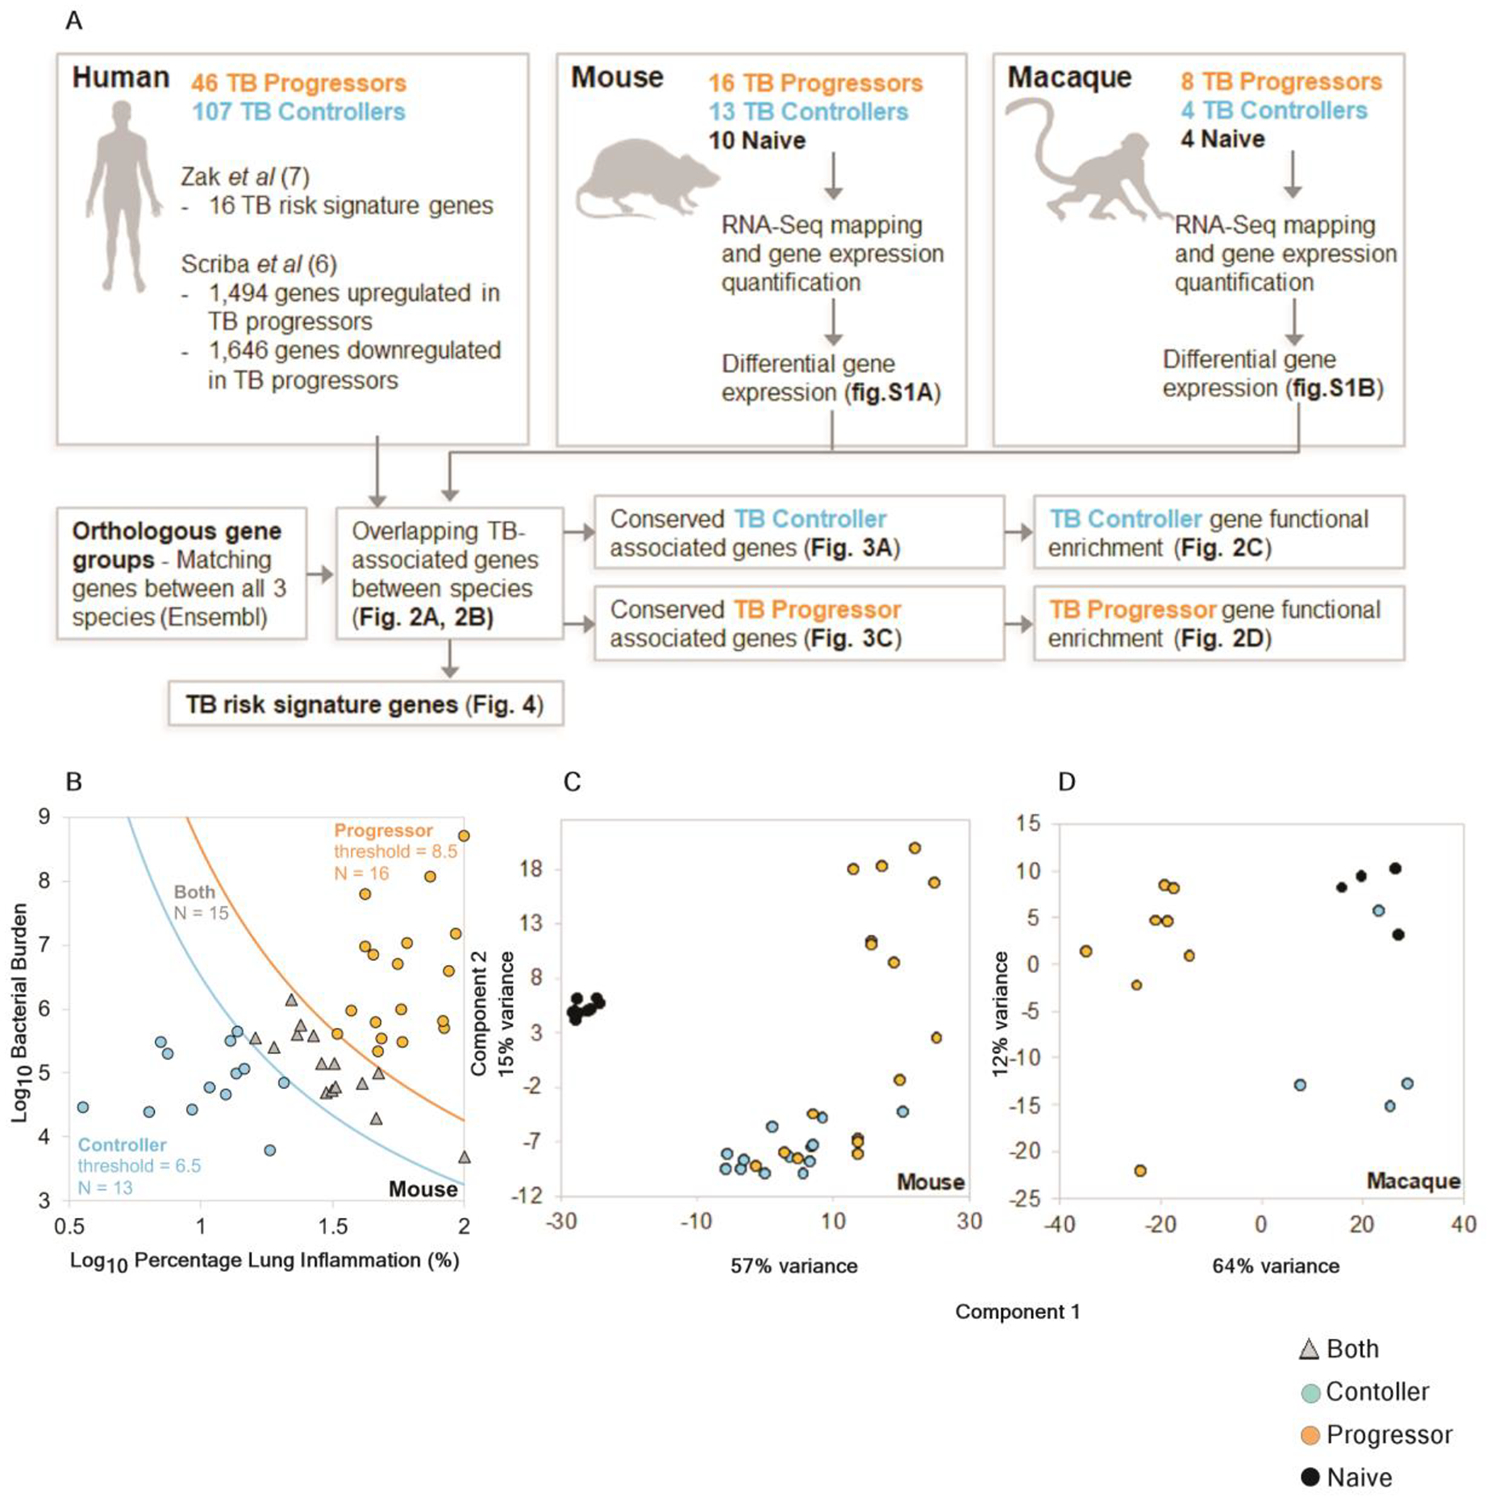
(A) Workflow of cross-species immune correlates of TB disease. (B) Mouse samples were divided into progressor and controller sample groups based on (Log10 bacterial burden) × (Log10 percentage lung inflammation), using thresholds of < 6.5 and > 8.5, respectively, (C) PCA clustering of the mouse RNA-Seq samples based on the default DESeq2 method (top 500 most variable genes) and (D) PCA clustering of the macaque RNA-Seq samples.