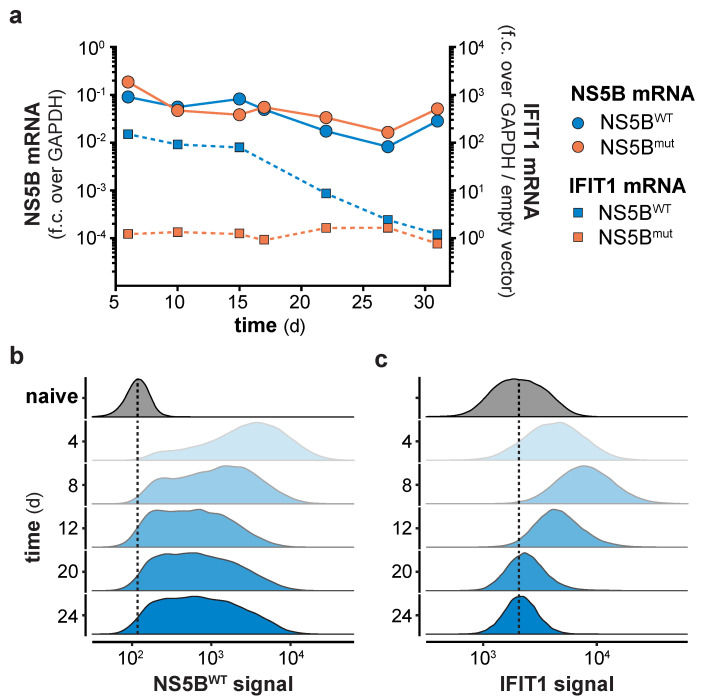
Figure 2.
Long term NS5B expression counter-regulates the IFN-stimulated genes (ISG) response. (a) NS5B and IFIT1 mRNA levels in A549 cells at the indicated days post NS5BWT or NS5Bmut transduction. NS5B fold change (f.c.) over GAPDH or IFIT1 fold change over GAPDH and empty vector control was calculated (mean ± s.d. of n = 3 technical replicates). One representative of n = 3 independent experiments is shown. NS5B-eGFP (b) and IFIT1 (c) protein levels in NS5BWT-eGFP transduced and naïve cells were determined by flow cytometry at the indicated days post transduction. Scaled density plots of fluorescent intensities were plotted individually for each time point after NS5BWT-eGFP transduction or by combining time points for naïve cells. Dashed lines highlight the median intensity in naïve cells.

