Figure 5.
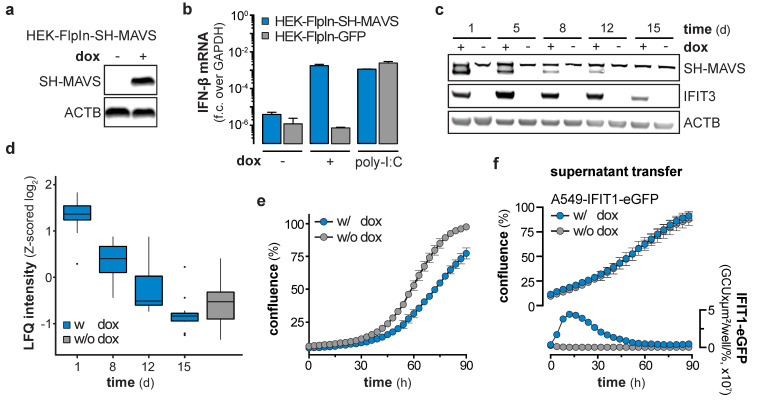
Counter selection of mitochondrial antiviral signaling protein (MAVS) expressing cells. (a) Western blot showing protein expression levels of StrepII-HA-tagged MAVS (SH-MAVS) and β-actin(ACTB) in doxycycline (dox)-treated HEK-FlpIn-MAVS cells. (b) IFN-β mRNA levels in HEK-FlpIn-GFP or -SH-MAVS cells, non-treated, 1 µg/mL dox-treated or poly-I:C (1 µg / 1 × 10⁶ cells) transfected for 1 day. Fold change (f.c.) over GAPDH was calculated (mean + s.d. of n = 2 technical replicates). (c) Western blot of SH-MAVS, IFIT3, and ACTB protein expression in HEK-FlpIn-MAVS cells non-treated or continuously treated with 1 µg/mL dox for the indicated days. (d) Total proteome analysis of HEK-FlpIn-MAVS cells non-treated or 1 µg/mL dox-treated for the indicated days. Box and whisker plots (median, hinges: 1st and 3rd quartiles, whiskers: ± 1.5 × inter-quartile-range) represent row-wise Z-scored median log2 LFQ intensities (n = 4 technical replicates) of proteins, overlapping with proteins significantly upregulated at 6 days post NS5BWT transduction. (e) Cell growth assay of HEK-FlpIn-MAVS cells non-treated or 1 µg/mL dox-treated for the indicated hours (mean ± s.d. of n = 9 technical replicates). One representative of n = 3 independent experiments is shown. (f) Cell growth and IFIT1-eGFP expression of A549-IFIT1-eGFP cells stimulated with the supernatant of 1 day 1 µg/µL dox-treated HEK-FlpIn-MAVS cells (mean ± s.d. of n = 4 technical replicates of n = 3 independent experiments). Left y-axis shows the percentage confluence and the right y-axis the IFIT1-eGFP expression based on the confluence-normalized green integrated intensity per well.

