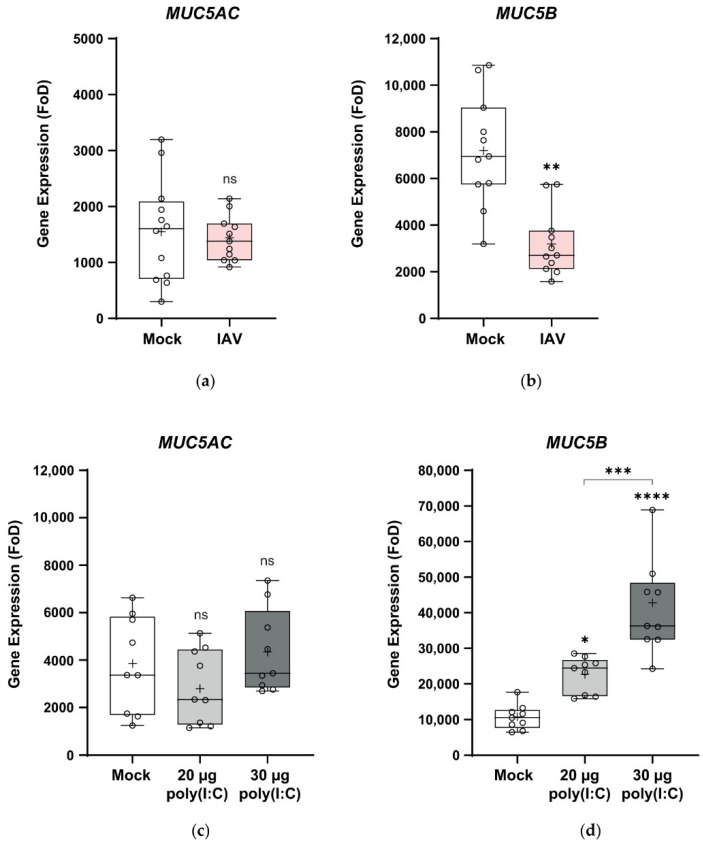
Figure 5.
Expression of the MUC5AC and MUC5B genes in response to H1N1pdm09 and poly(I:C). The expression of MUC5AC and MUC5B in airlifted NHBE cells was assayed by RT-qPCR. (a) MUC5AC and (b) MUC5B expression 30 h postinfection with H1N1pdm09 (IAV) versus mock-inoculated cells and (c) MUC5AC and (d) MUC5B expression 48 h post-treatment with 20 μg and 30 μg poly(I:C) in comparison to mock-treated cells. Gene expression was normalized to GAPDH and is shown as fold over detectable (FoD), where the minimum level detectable was set at 40 cycles. Data from three independent experiments were pooled for each of IAV and poly(I:C) and are presented as box and whisker plots which show the mean (+), median, interquartile range and maximum and minimum values. The ends of each box represent the upper and lower quartiles, the horizontal line within the box indicates the median value and error bars show the minimum and maximum values. Individual values are depicted by open circles. IAV data: Mock, n = 12; IAV, n = 11 (MUC5AC) and Mock, n = 11; IAV, n = 11 for MUC5B; poly(I:C) data n = 9 biological replicates per treatment. Statistical significance: ns, not significant; *, p < 0.05; **, p < 0.01; ***, p < 0.001; ****, p < 0.0001.

