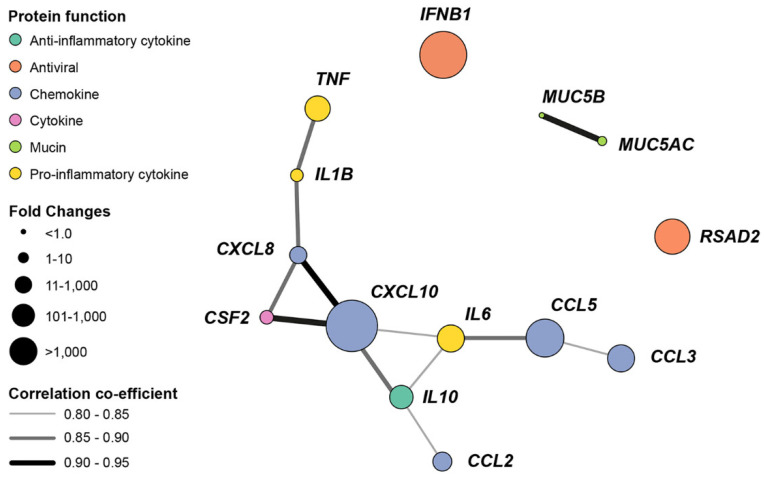
Figure 6.
Pandemic IAV H1N1pdm09 upregulates the expression of cytokine, chemokine and antiviral genes in wdNHBE cells. The gene coexpression network depicts nodes representing the assayed genes, node size represents the magnitude of fold-change and edges (lines linking nodes) indicate the strength of the coexpression as quantified by the Pearson Correlation Coefficient. The threshold for visualizing coexpression was set at 0.80. Gene naming follows the HUGO Gene Nomenclature Committee (HGNC) [100].

