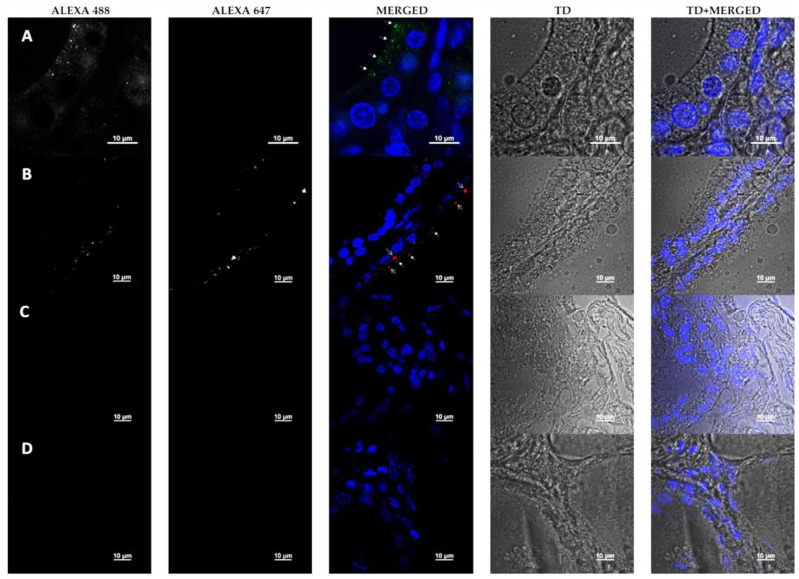
Figure 4.
Fluorescent microscopy of thyroid gland tissue. Dyes: DAPI—nucleus; Alexa488—HHV-6 gp82/105 (closed tip arrows (bold)); Alexa647—RANTES (opened tip arrows (sharp)); TD—transmitted light. Channels Alexa488 and Alexa647 are shown in greyscale for better contrast. Row A—part of a thyroid lobule of a patient with Grave’s disease; Row B—limitrophe zone of two separate thyroid follicles of a patient with Grave’s disease; Row C—control patient’s (with adenoma) thyroid lobule; Row D—staining control (secondary antibodies and DAPI only).

