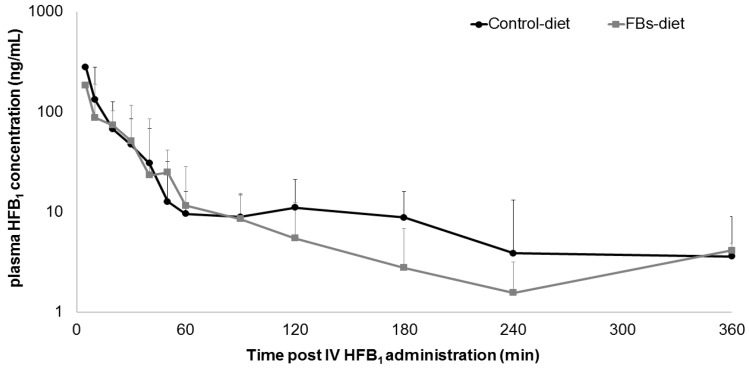
Figure 2.
Comparative plasma concentration−time profile of HFB1 after intravenous (IV) administration of 1.25 mg HFB1/kg bodyweight to broiler chickens fed either a control diet (n = 8) or a fumonisins (FBs)-contaminated diet (10.8 mg FB1, 3.3 mg FB2 and 1.5 mg FB3/kg feed, n = 8) for two weeks. Values are presented as mean + standard deviation (SD).

