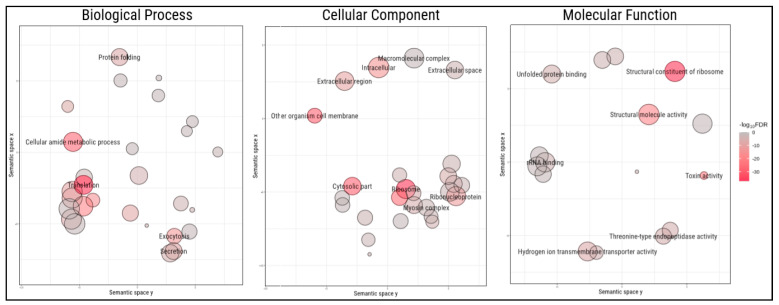
Figure 3.
Enriched gene ontologies among highly expressed genes in Steatoda nobilis venom glands. Circles represent significant gene ontologies, arranged according to their semantic space. The size of the circles represents the number of genes associated to the given ontology in the dataset, while the colours represent the −log10 false discovery rate for the ontologies’ enrichment.

