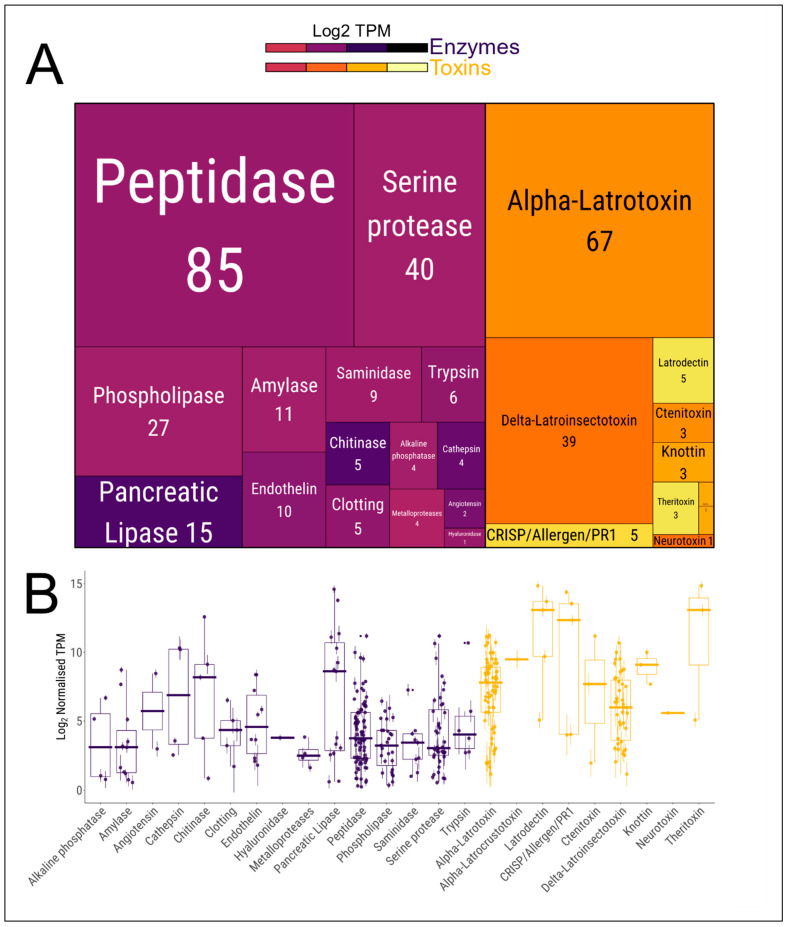
Figure 4.
Relative abundance and expression level of genes encoding predicted venom enzymes and toxins. (A) Treemap chart of the main classes of venom-related enzymes and toxins present in Steatoda nobilis venom gland transcriptome. The size of the rectangles is proportional to the number of genes in each category, indicated under the labels. The colour represents the log2 transcripts per millions (TPM) of the median expression of the genes in each category. (B) Expression levels of each gene in each enzyme/toxin category. Dots represent the mean expression of individual genes across three biological replicates ± SD; purple: enzymes, orange: toxins.

