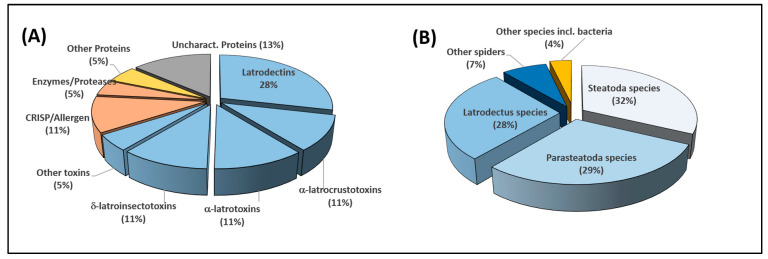
Figure 7.
(A) Pie-chart showing the relative abundance of the 199 proteins quantified in the venom of Steatoda nobilis, arranged into families. The blue slices detail the toxin content of the venom. The orange slices are non-toxin proteins that are important to venom activity. The yellow slice represents the proteins not directly related to venom (e.g., hemocyanins). The grey slice comprises all the proteins with undetermined biological activity. (B) Pie-chart showing the relative abundance of the 199 quantified proteins, arranged by genera with matching sequences (determined by BLAST).

