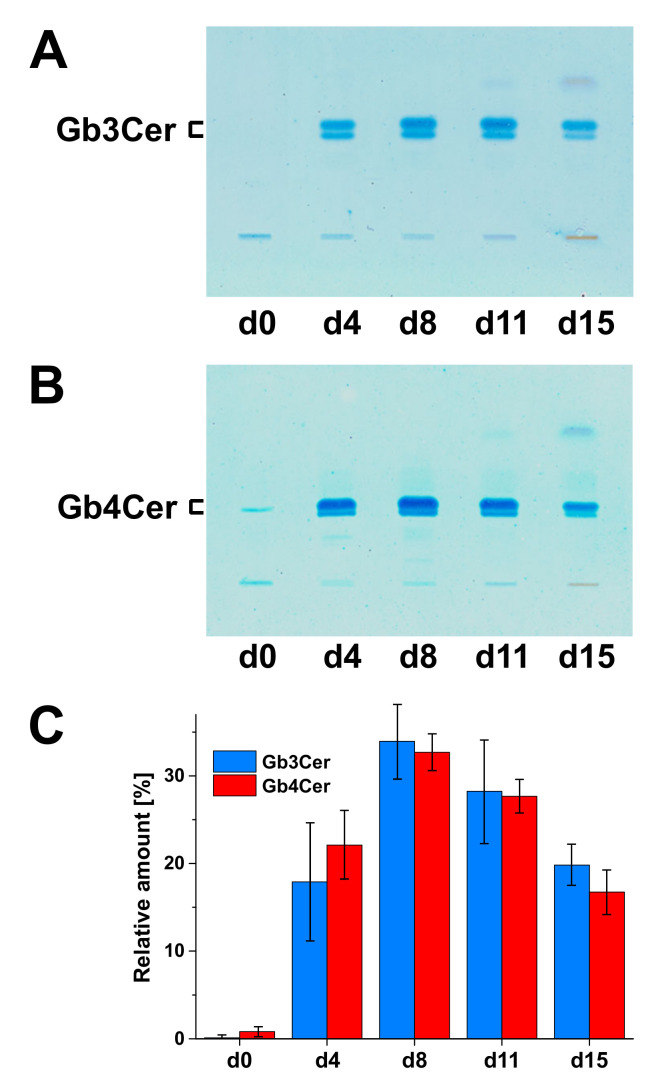
Figure 7.
Immunochemical detection of Gb3Cer (A) and Gb4Cer (B) and portrayal of the dynamic change of Gb3Cer and Gb4Cer content during the ex vivo propagation of erythroid progenitor cells (C). The detection of TLC-separated Gb3Cer and Gb4Cer in lipid extracts of donor 2, which correspond to 1 × 10⁶ cells, each, was conducted with an anti-Gb3Cer and anti-Gb4Cer antibody, respectively. The bar chart depicts the averaged TLC scanning values of three donors showing the relative ascent and descent of Gb3Cer and Gb4Cer content during ex vivo erythropoiesis (see Figure 4 and Figure 5) ([145], modified).

