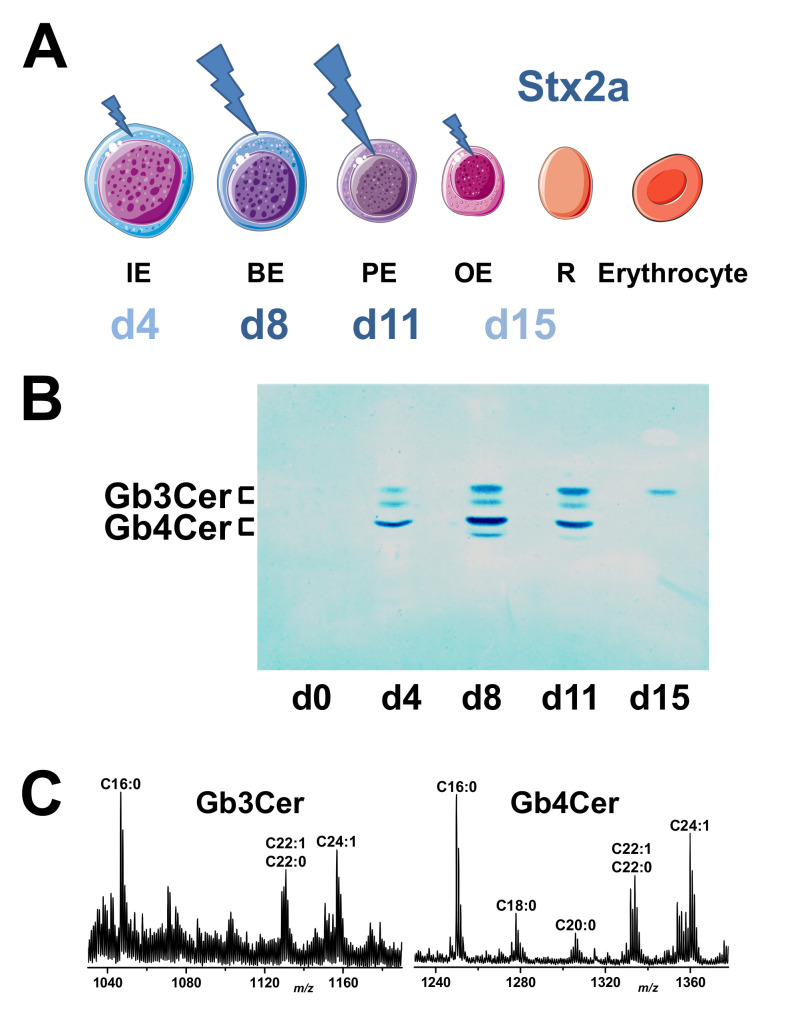
Figure 8.
Scale of Stx2a-mediated cell damage over time during 15 days of ex vivo expansion of erythroid cells (A) and Stx2a TLC attachment toward Gb3Cer and Gb4Cer of the developing erythrocytes (B) together with mass spectra showing the various lipoforms of Stx2a-binding Gb3Cer and Gb4Cer (C). (A) The figure was adapted from SERVIER MEDICAL ART (https://smart.servier.com). IE, immature erythroblast (proerythroblast); BE, basophilic erythroblast; PE, polychromatophilic erythroblast; OE, orthochromatophilic erythroblast; R, reticulocyte (see Figure 1). This panel summarizes the data of the May–Grünwald–Giemsa-stained cell samples shown in Figure 4 and Figure 5, and the viability assays of cellular Stx2a exposure depicted in Figure 6. (B) The Stx2a overlay assay was performed with aliquots of lipid extracts prepared from cell samples of donor 2, each equal to 1 x 10⁶ cells, and served as a representative example of three donors. (C) The Gb3Cer and Gb4Cer mass spectra were produced from extracts of TLC overlay-detected Gb3Cer and Gb4Cer (see Figure 7) of cell samples from donor 2 corresponding to day 8 of the ex vivo cell culture (for structures, see Figure 2) ([145], modified). The respective ceramide moieties harbor sphingosine (d18:1) as the invariable portion linked with a fatty acid variable in carbohydrate chain length from C16 up to C24, as indicated in the spectra.

