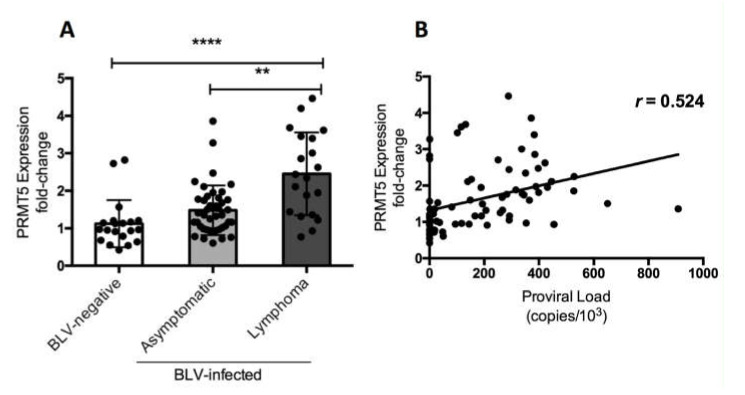
Figure 3.
PRMT5 gene expression at the RNA level in BLV-infected cattle with lymphoma. (A) PRMT5 expression at the RNA level of 20 BLV-negative cattle, 42 BLV-infected but clinically normal cows, and 20 BLV-infected cattle with lymphoma were measured by qRT-PCR and the fold-change was calculated using the ΔΔCT method with normalization to GAPDH expression as an internal control. Samples were run in duplicate. A scatter plot with a bar showing the mean of the fold-change in PRMT5 expression of the three groups of cattle. BLV PVL was measured by CoCoMo-qPCR. The p value was calculated using the Kruskal-Wallis test (<0.0001) and Dunn’s multiple comparisons test was used to evaluate the significance among groups. The asterisk indicates a significant difference (** p ≤ 0.001 and **** p ≤ 0.0001). (B) Correlation between BLV PVL of each cow and corresponding PRMT5 expression fold-change (81 in total), Spearman r was used to evaluate the strength of the correlation.

