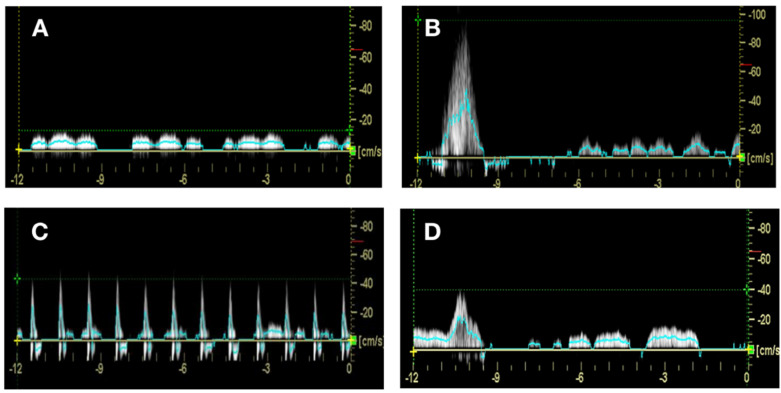
Figure 1.
Blood flow waveforms from all interventions. Representative waveform from (A) baseline, (B) voluntary contraction, (C) GekoTM, and (D) NUI Galway device. The measurement window for all test conditions included 1 s before stimulation and 11 s of blood flow post stimulation onset. Peak velocity was measured off the crossing point of the blood flow waveform and the horizontal dashed line in green. The TAMEAN is plotted as a solid blue line over the course of the measurement.

