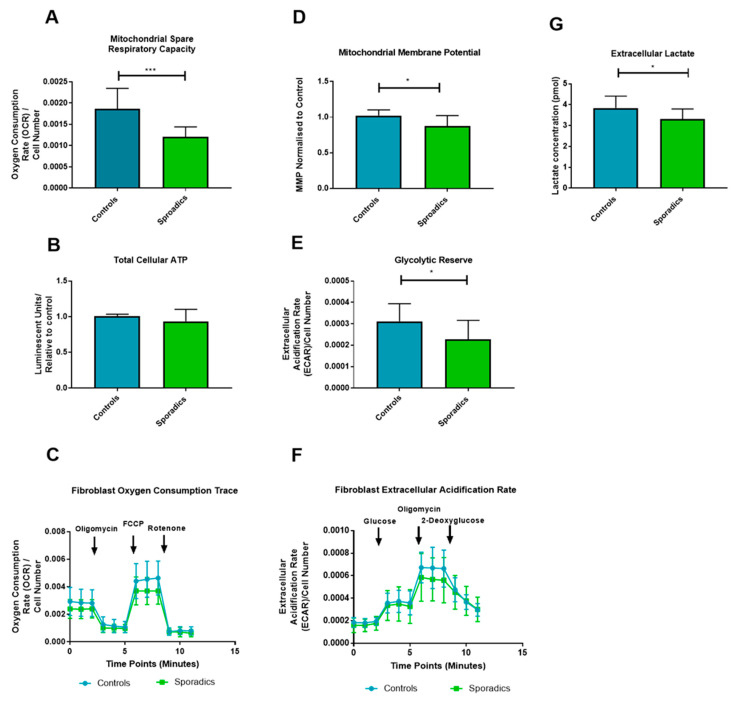
Figure 2.
Oxidative phosphorylation and Glycolytic fibroblast Assessment: *** = p < 0.001; * = p < 0.05. Significant reductions in mitochondrial spare respiratory capacity (A), Mitochondrial Membrane potential (D), Glycolytic Reserve (E) and Extracellular lactate (G) was detected in sAD when compared to controls. No significant difference was seen in total cellular ATP (B). OCR and ECAR traces for mitochondrial stress test and glycolysis stress test are displayed in panels (C) and (F) respectively. For all panels controls are represented in blue and sAD are represented in green. Graphs represent mean with error bars indicating standard deviation.

