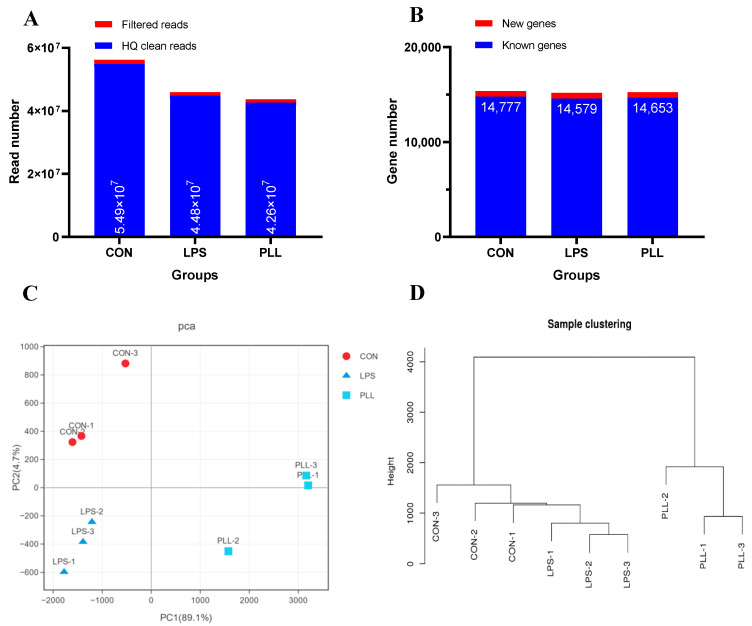
Figure 1.
The statistics of gene expression profiles. (A) The number of filtered and high-quality (HQ) clean reads. (B) The number of new and known genes. (C) The principle component analysis (PCA) plot of global gene expression profiles of the samples. (D) The sample clustering tree. CON, control group; LPS, lipopolysaccharide group; PLL, the group of co-stimulation with peptidoglycan (PGN), lipoteichoic acid (LTA), and LPS.

