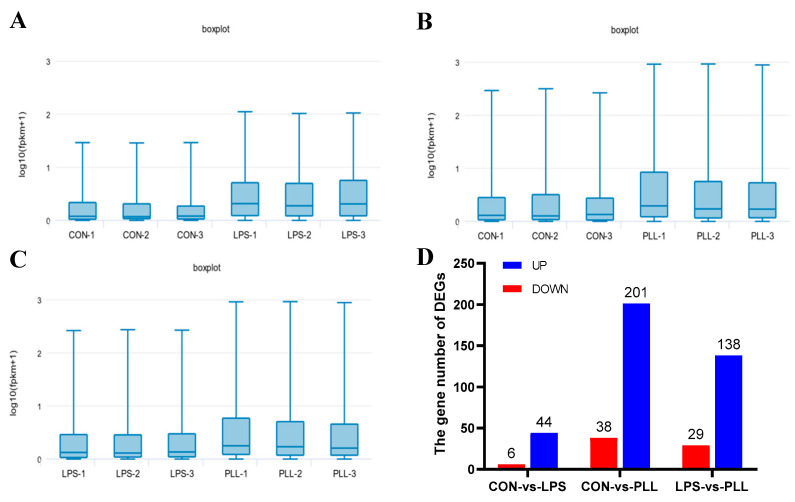
Figure 2.
The statistics of gene expression levels and differentially expressed genes (DEGs). (A) The boxplots of gene expression levels in the CON and LPS groups. (B) The boxplots of gene expression levels in the CON and PLL groups. (C) The boxplots of gene expression levels in the LPS and PLL groups. (D) The statistics of the number of DEGs in the three comparative conditions (CON vs. LPS, CON vs. PLL, and LPS vs. PLL). CON, control group; LPS, lipopolysaccharide group; PLL, the group of co-stimulation with peptidoglycan (PGN), lipoteichoic acid (LTA), and LPS; log10 (fpkm + 1), log10 (fragments per kilobase million + 1); UP, up-regulated DEGs; DOWN, down-regulated DEGs.

