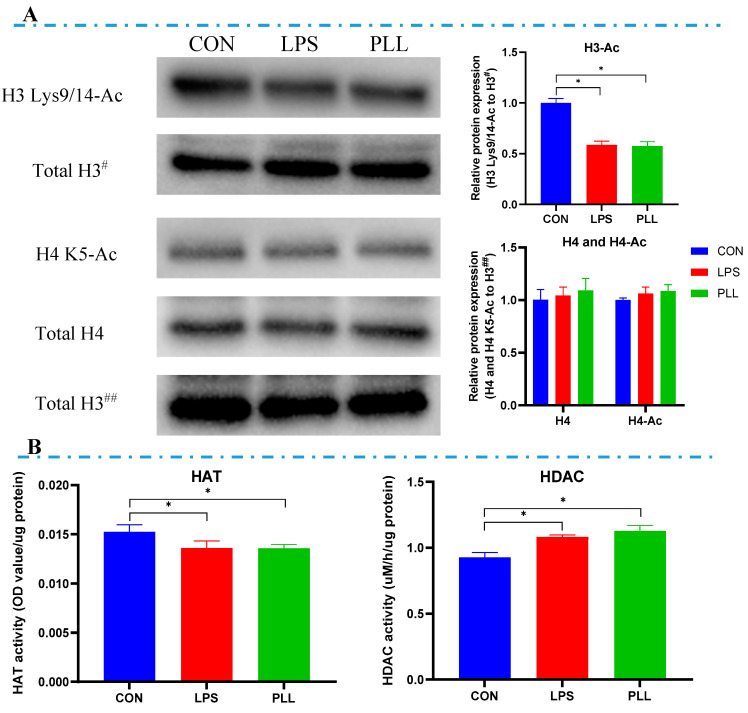
Figure 7.
The acetylation levels of histones (H3 and H4) and the activity of histone acetyltransferase (HAT) and histone deacetylase (HDAC). (A) Histone acetylation (H3 Lys9/14-Ac and H4 K5-Ac) levels detected by Western blot and quantification analysis. Protein loading was normalized to histone H3 protein which served as an internal control. Total H3# is an internal control for H3 Lys9/14-Ac. Total H3## is an internal control for histone H4 and H4 K5-Ac. Quantitation of blots was performed by densitometric analysis and was representative of three independent trials. (B) HAT and HDAC activity measured by enzyme-linked immunosorbent assay (ELISA). Cells were collected 24 h after the stimulation to isolate nucleoprotein for Western blot and ELISA (n = 6). The data are presented as mean ± standard deviation (SD). The error bars represent standard deviation, and the asterisk indicates statistical difference (* p < 0.05) between the indicated columns, based on one-way analysis of variance followed by Duncan’s multiple comparison test. CON, control group; LPS, lipopolysaccharide group; PLL, the group of co-stimulation with peptidoglycan (PGN), lipoteichoic acid (LTA), and LPS.

