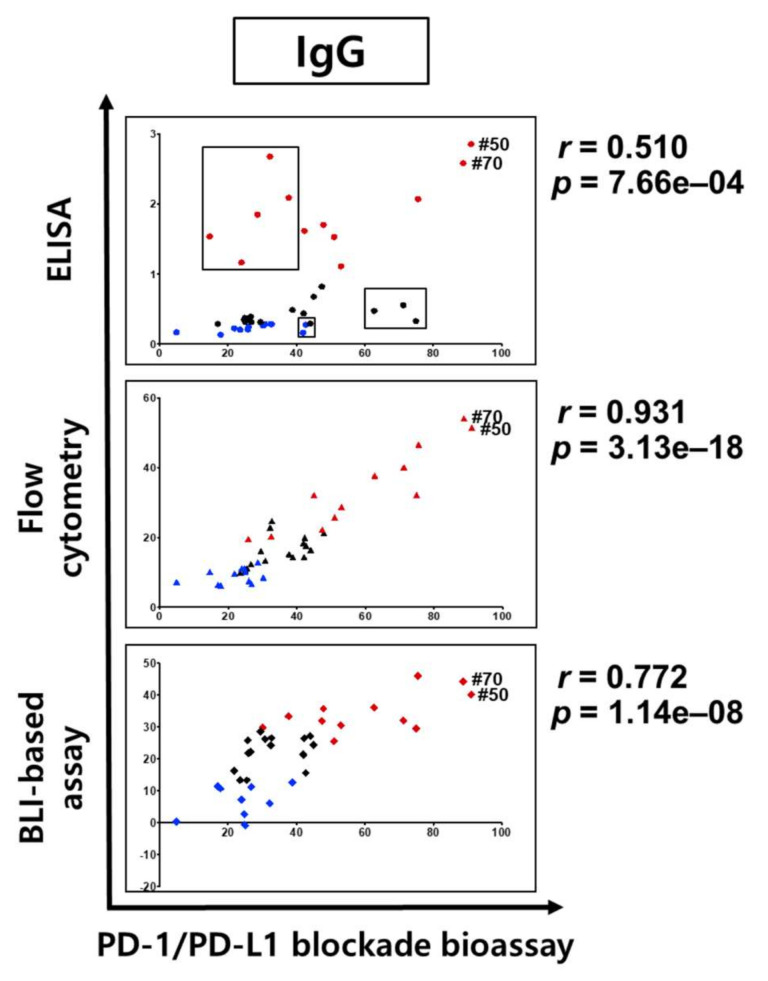
Figure 5.
Correlation analysis of binding and inhibitory activities of IgG format antibodies. Comparative analysis of binding specificities and in vitro activity according to antibody formats. The vertical axis is the binding and binding inhibition activity in ELISA (circle, 450 nm), flow cytometry (triangle, MFI; mean fluorescence intensity), and BLI-based PD-1/PD-L1 binding inhibition assay (diamond, inhibition %), and the horizontal axis is the PD-1‒PD-L1 interaction inhibitory activity (relative luminescence %) of the antibodies. For the BLI-based PD-1‒PD-L1 binding inhibition assay using IgG, clones #41 (‒144%) and #71 (‒37.63%) are not indicated. Poorly correlated clones are represented by three black boxes. The Pearson correlation coefficient (r) and p-value (p) are given in the top panel (r = 0.510, p = 7.66 × 10⁻⁴), middle panel (r = 0.931, p = 3.13 × 10⁻¹⁸), and bottom panel (r = 0.772, p = 1.14 × 10⁻⁸). Results are classified using color shading codes, with the top 30% in red and the bottom 30% in blue (IgGs; 30%; 12/40 clone) in each of the three assays (ELISA, flow cytometry, and BLI-based PD-1/PD-L1-binding inhibition assay).

