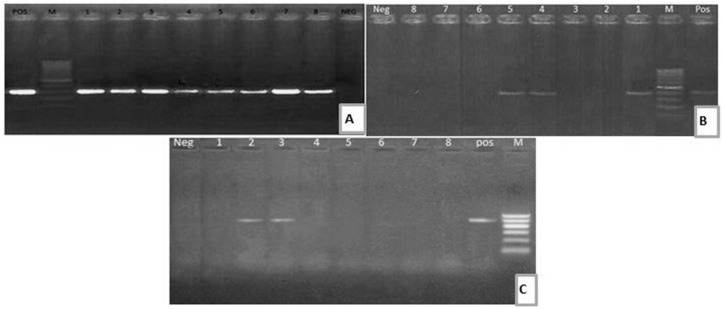
Figure 1.
(A) Electrophoretic pattern of aadB (319 bp): M: 100–1000 bp DNA ladder; POS: Positive control; Neg: Negative control; Lanes: 1–8: positive E. coli strains. (B) Electrophoretic pattern of sul1 gene (433 bp): M: 100–1000 bp DNA ladder, POS: Positive control; Neg: Negative control; Lanes: 1, 4, 5: positive E. coli strains; Lanes: 2, 3, 6, 7, 8: negative E. coli strains. (C) Electrophoretic pattern of blaTEM gene (516 bp): M: 100–600 bp DNA ladder; POS: Positive control; Neg: Negative control; Lanes: 2–3: positive E. coli strains; Lanes: 1, 4, 5, 6, 7, 8: negative E. coli strains.

