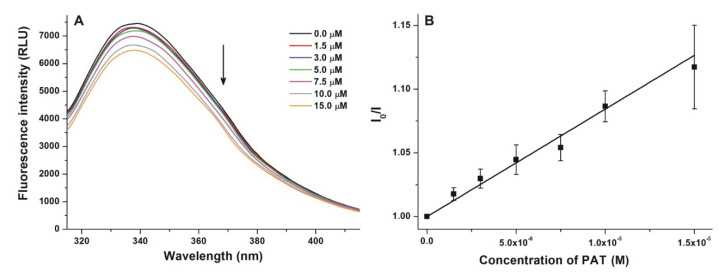
Figure 6.
(A) Fluorescence emission spectrum of human serum albumin (HSA; 2 μM) in the presence of increasing concentrations (0–15 µM) of patulin (PAT) in phosphate-buffered saline (PBS, pH 7.4). (B) Stern–Volmer plot of PAT–HSA interaction (λex = 295 nm, λem = 340 nm; ex slit = 10 nm, em slit = 10 nm; RLU: relative light unit).

